Climate change rule of thumb: cold "things" warming faster than warm things
This week, Beyond the Data looks at one of the more well-grounded “rules of thumb” for understanding climate change. This one is pretty simple to put your thumb on: on average, cooler places and cooler times are warming more quickly than warmer places and times.
But first, let’s clarify–and emphasize–what we mean by a “rule of thumb.” Just like in its common usage, a rule of thumb here refers to something generally true often enough to be useful and informative, but not universally reliable–kind of a “two-out-of-three” or “three-out-of-four” kind of situation.
So, it's nothing to thumb your nose at, because it’s true more often than not. But it’s also not the case everywhere. Local exceptions to the rule may be in the minority, but they don’t completely stick out like a sore thumb because in certain local situations, the facts can be … wait for it … opposable.
With that definition and some horrible puns out of the way, let’s thumb through some data.
Colder places are warming faster than warmer places
This rule of thumb is really dominated by the fact that the arctic is the fastest-warming large region on the planet. The Arctic is warming at more than twice the rate of the rest of the world. This “Arctic amplification” is driven by a handful of factors; the largest of these is the retreat of seasonal snow and ice. As the white stuff goes away, it exposes darker surfaces and land cover underneath; this introduces an additional warming effect across the region.
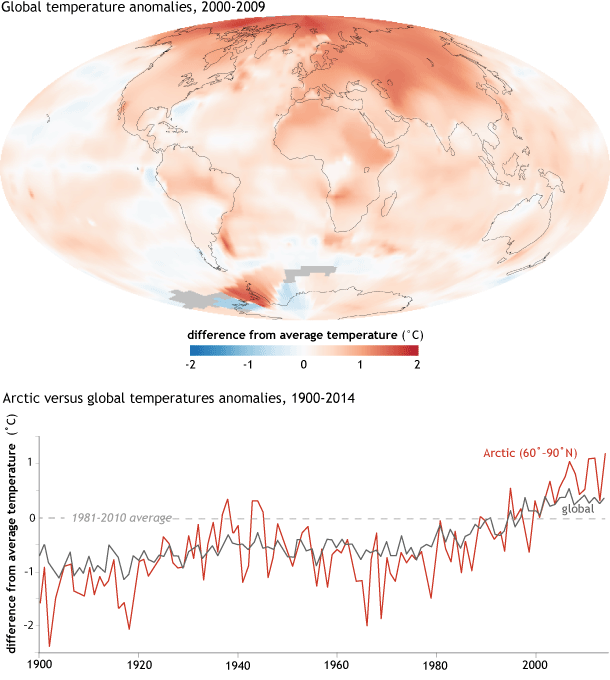
(top) Arctic amplification of climate change evident in map of 2000-2009 temperatures compared to the 1951-80 average. NASA Earth Observatory map, based on data from NASA GISS. (bottom) Yearly October-September temperatures compared to the 1981-2010 average. Black line: global average. Red line: Arctic (60°-90°N) average. Graph by NOAA Climate.gov, adapted from Figure 1.1 in the 2014 Arctic Report Card.
The graph above clearly shows the Arctic region’s steeper temperature climb. But the map of temperatures from the most recent completed decade (2000-09) also hints at (remember: we’re talking rule of thumb here) the effect of additional warming across traditionally seasonally snow-covered areas in Siberia.
The migration of seasonal snow lines isn’t just a north-south latitude thing; it’s also an up-down altitude thing. On mountains themselves, there is a noticeable effect of increased warming at mountain stations near the average snow/no-snow line, which is leaning more toward no-snow– and thus, additional warming–in recent years. The rate of warming with elevation in general is complex – probably too complex to qualify as a rule of thumb, but there is evidence that high-elevation places are warming more, on average, than lower elevation places.
Colder seasons are warming faster than warmer seasons
In most of the mid-latitudes, where most Americans live, and where we have something resembling four seasons each year, the cold season is warming the most rapidly of all. This shows up clearly in the US temperature record, particularly during the last quarter-century, when the excursions from the long-term average are much larger during the winter season than the summer.
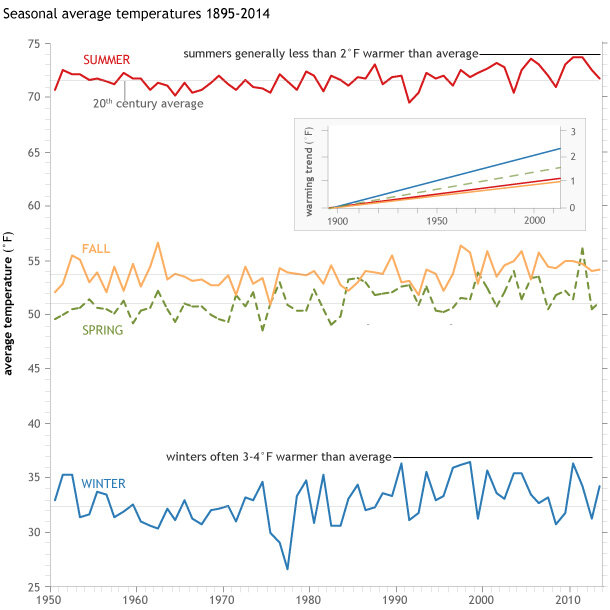
Seasonal temperatures from 1895-2014 compared to the twentieth-century averages (gray lines). (Inset) Trends since the start of the twnetieth century for the four seasons. Graph by NOAA Climate.gov, based on NCEI Climate at a Glance data.
The inset zooms out to the last century. Since the turn of the 20th century, the nation’s average winter (December through February) temperature has increased by almost twice the rate of the summer (June through August) temperature, at 2.0°F per century versus 1.1°F per century, respectively.
Colder times of day are warming more than warmer times of day
If you’ve been following the National Center for Environmental Information’s monthly reports (and you should!), you may have noticed that this year’s extensive warmth in the western United States is driven by extremes in minimum (overnight low) temperatures, even more so than maximum (afternoon high) temperatures. And that’s not just a snapshot, it’s a trend. As the world warms, nighttime temperatures are slightly outpacing daytime temperatures in the rate of warming. Technically speaking, since 1900, the rate of warming for overnight temperatures is 1.45°F per century, versus a daytime warming of 1.13°F per century. That may not seem like a big deal, until you realize that the nighttime rate is more than 20%* higher than the daytime rate.
The relative warming of nighttime temperatures also translates strongly into the pattern of extremes, which tend to amplify changes in the baseline. The graphic below depicts the US Climate Extremes Index, or CEI for short, for overnight temperatures (top panel) and afternoon temperatures (bottom panel) for each summer since 1910.
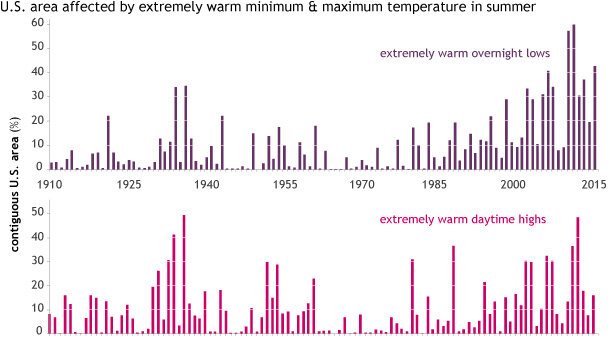
Climate Extremes Index components for summer temperature extremes across the contiguous United States (CONUS) since 1910. (Top) Percent of the CONUS that experienced extremely warm overnight lows each summer. (Bottom) Same, but for extremely warm afternoon highs. Graph by NOAA Climate.gov, baed on NCEI Climate Extremes Index data (Step 1).
The CEI is a powerful tool we use to analyze changes in the behavior of extreme climate conditions over time. It effectively shows how much of the country has experienced extreme conditions over time, so the bars on these graphs represent the size of the footprint of extreme conditions during the summer months.
Let’s switch to the extremely cool (for summer) side of the coin. It’s less obvious than before, but the expanse of extremely cool overnight lows (in blue) is shrinking more rapidly than for extremely cool daytime highs (orange). Since the mid-1990s, with one or two exceptions, the area affected by extremely cool overnight lows is in the low single digits. Again, the cooler time of the day shows more effects of warming than the warmer time.
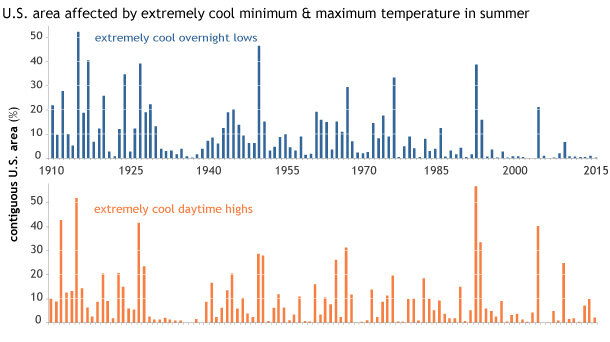
Climate Extremes Index components for summer temperature extremes across the contiguous United States (CONUS) since 1910. (top) Percent of the CONUS that experienced extremely cool overnight lows each summer. (bottom): same, but for extremely cool afternoon highs. NOAA Climate.gov graph, based on NCEI Climate Extremes Index data (Step 2).
The coverage of extremely warm overnight temperatures dwarfs that of afternoon temperatures in recent decades. This is not just an obscure climate statistic: it has significant real-world implications. Extremely warm morning temperatures may not be as sexy as triple-digit afternoon temperatures, but in many ways, morning temperatures are more important.
Warmer nights mean public health challenges, as sunrise laborers ply their trade with a warmer baseline. The poor, the elderly, and especially the poor-and-elderly are more sensitive when they can’t “reset” even for a few hours overnight without the aid of air conditioning. Agriculture and horticulture face similar stresses. Steers just can’t keep weight on when stressed by 24-hour warmth. And finally, those of us fortunate to have air conditioning run it deeper into the night, which raises both energy demand and cost, and contributes even more to the ultimate driver of global warming.
Coda
So, there you have it. The cool places and the cool seasons and even the cooler times of day are warming more than the warmer places, seasons and times. It’s a rule of thumb, which means that there are plenty of exceptions, but more often than not, it’s true.
I hope you give this blog your “thumbs up” in the ratings feature just to the right. Thanks for going Beyond the Data.