Back to the Basics: Precipitation Patterns
Last week’s Beyond the Data post examined the extreme temperature climates in the United States, as defined by station “normals.” We promised to come back and look at the precipitation extremes, and here we are.
First, a reminder: this information, for a subset of about 450 stations across the United States, is available through this tool. We’ve left the settings at the default “don’t give me stations within 20 miles of each other” setting. Jump in and play with the data yourself!
The Wettest and Driest Places in America
The tables below list the ten wettest and ten driest locations in the United States. Again, these are annual normals, or what would be expected in the mythical “average” year.
| Ten wettest stations in the United States | Ten driest stations in the United States | |||||||
| Station | State | Annual Precip | Station | State | Annual Precip | |||
| 1 | Yakutat State Airport | AK | 155.12" | 1 | Yuma Airport | AZ | 3.30" | |
| 2 | Ketchikan Int’l Airport | AK | 141.25" | 2 | Las Vegas | McCarran Airport | NV | 4.19" | |
| 3 | Hilo Int’l Airport | HI | 126.72" | 3 | Barrow | Post-Rogers Airport | AK | 4.53" | |
| 4 | Annette Island Airport | AK | 101.63" | 4 | Bishop Airport | CA | 5.17" | |
| 5 | Quillayute State Airport | WA | 99.54" | 5 | Mercury | Desert Rock Airport | NV | 5.93" | |
| 6 | Mt. Washington | NH | 96.87" | 6 | Bakersfield Airport | CA | 6.47" | |
| 7 | Cordova | M.K. Smith Airport | AK | 90.42" | 7 | Big Piney | Marbleton Airport | WY | 6.48" | |
| 8 | Sitka Airport | AK | 86.81" | 8 | Winslow Municipal Airport | AZ | 7.01" | |
| 9 | Stampede Pass | WA | 81.23" | 9 | Alamosa San Luis Airport | CO | 7.31" | |
| 10 | Kodiak Airport | AK | 78.00" | 10 | Lancaster | William J. Fox Field | CA | 7.38" | |
Unlike extreme temperature stations, which were dominated by where you are on a map, the “ten wettest” list is dominated by what you see when you look out the window on a clear day. It’s no accident that all of these stations are within a few miles of some pretty substantial summits: mountains play a huge role in local precipitation.
That cements our first precipitation truism: the windward sides of mountain ranges tend to be significantly wetter than the leeward sides.
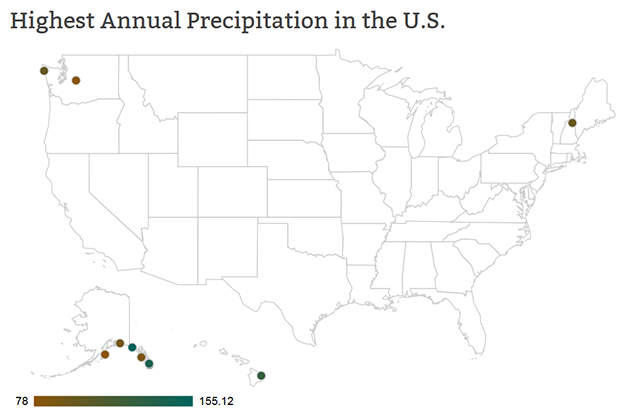
A map of the 10 places in the U.S. with the highest annual precipitation. Map produced with NOAA NCEI U.S. Climate Extremes Tool.
How does that work? The mountains provide the mechanism to lift moist air until it cools enough to condense cloud droplets (or form snowflakes) that are big enough to fall to earth. Or, to put it a little less technically, the mountains will “wring out” the precipitation from moist air.
Unlike other weather mechanisms, like cold fronts and warm ocean waters, the mountains don’t go away. Basically, all that’s needed is some moist air being driven toward higher elevations.
In most cases, the warmer the air, the more water vapor it can “hold”, and therefore deliver. But, as this list clearly shows, the cool, damp air of the Gulf of Alaska is plenty moist to dump tubs of rain (and snow!) onto Alaska’s southern mountains.
Each of the listed Alaskan stations sits along Alaska’s southern coast, where the ocean, the mountains, and a persistent low-pressure feature – the “Alaskan low” – work together to produce prolific rainmaking.
The dry side of the table underscores the corollary of the first point: the leeward reaches of mountain ranges tend to be much drier than the windward side. Many of the dry stations sit just east of a significant mountain range. After the moisture is wrung out on the windward side, the air will warm as it descends. This warming brings the air out of saturation – it is plenty capable of “holding” the remaining water vapor – which means precipitation doesn’t happen in most situations.
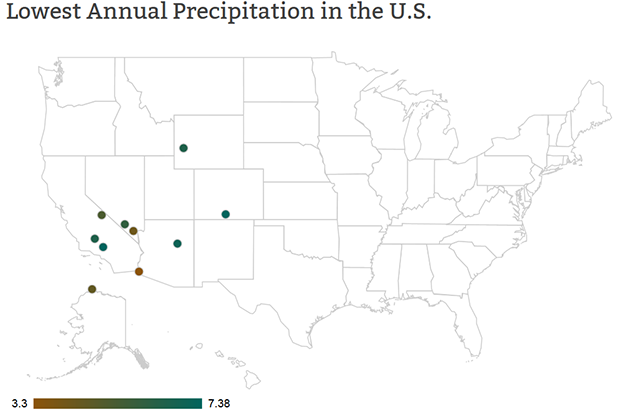
A map of the 10 places with the lowest annual precipitation in the United States. Map produced with NOAA NCEI U.S. Climate Extremes Tool.
It’s also worth noting, looking across these lists, that the wet stations are comfortably in the far northern regions of the country. And many of the dry stations, especially those that aren’t obviously in the “rain shadow” of a mountain range, are at sub-tropical latitudes. The world’s major deserts sit at around 25 to 30 degrees latitude.
The exceptions to the above are: 1) Barrow, Alaska, which is so far north and so cold, that there’s just not a great deal of precipitation, and 2) Hilo, Hawaii, which is so far south that it’s tropical. Hilo also sits on the east side of a major summit, the windward side in the tropics, where the prevailing winds are easterly.
Or, to sum it up in a truism: all else being equal, subtropical latitudes tend dry.
The following table lists the places with the most, and the least, days per year with precipitation.
| Places with the most frequent precipitation | Places with the least frequent precipitation | |||||||
| Station | State | Days/Year with Precip | Station | State | Days/Year with Precip | |||
| 1 | Hilo Int’l Airport | HI | 272.1 | 1 | Yuma Airport | AZ | 17.9 | |
| 2 | Cold Bay Airport | AK | 249.3 | 2 | Las Vegas | McCarran Airport | NV | 26.5 | |
| 3 | Yakutat State Airport | AK | 240.1 | 3 | Bishop Airport | CA | 27.6 | |
| 4 | Sitka Airport | AK | 235.6 | 4 | Lancaster |William J. Fox Field | CA | 28.8 | |
| 5 | Ketchikan Int’l Airport | AK | 233.9 | 5 | Mercury | Desert Rock Airport | NV | 32.1 | |
| 6 | Annette Island Airport | AK | 231 | 6 | Long Beach |Daugherty Field | CA | 35.2 | |
| 7 | Juneau Int’l Airport | AK | 229.8 | 7 | Burbank-Glendale-Pasadena Airport | CA | 36.5 | |
| 8 | Cordova | M.K. Smith Airport | AK | 219.9 | 8 | Phoenix | Sky Harbor Int’l Airport | AZ | 36.6 | |
| 9 | Mt. Washington | NH | 210.4 | 9 | Sandberg | CA | 37.7 | |
| 10 | Quillayute State Airport | WA | 206.3 | 10 | Bakersfield Airport | CA | 39.2 | |
What do these tables tell us? They tell us that the places that get the most and least precipitation per year also get the most and fewest days with precipitation. Let’s not overthink this.
Snowfall
Finally, the ten snowiest places in the United States:
| Places with the most annual snowfall | |||
| Station | State | Annual Snowfall | |
| 1 | Valdez | AK | 326.3" |
| 2 | Mt. Washington | NH | 281.2" |
| 3 | Hancock | Houghton County Airport | MI | 207.7" |
| 4 | Yakutat State Airport | AK | 143.4" |
| 5 | Talkeetna Airport | AK | 137.1" |
| 6 | Syracuse | Hancock Int’l Airport | NY | 123.8" |
| 7 | Sault Ste. Marie | Sanderson Field | MI | 120.4" |
| 8 | Caribou Municipal Airport | ME | 108.7" |
| 9 | Flagstaff | Pulliam Airport | AZ | 101.7" |
| 10 | Traverse City | Cherry Capital Airport | MI | 101.4" |
What does this list tell us? Well, first, oddly, apparently having “Hancock” in your airport’s name sets you up for snow.
As you’d expect, the more northern and higher-elevation places make the list. But the influence of the Great Lakes really pops in this list. Large, relatively warm bodies of water, especially in the early winter, can juice snow-making storms with even more moisture and atmospheric instability. Being downwind of a Great Lake means you experience this early and often in the winter.
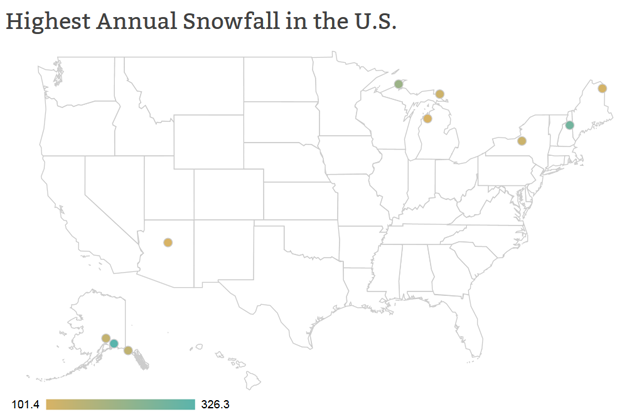
A map of the 10 places with the highest annual snowfall in the United States. Map produced with NOAA NCEI U.S. Climate Extremes Tool.
Or, presented as a truism: The Great Lakes Make Great Flakes
Thanks for joining us in a back-to-the-basics Beyond the Data.