
Image caption
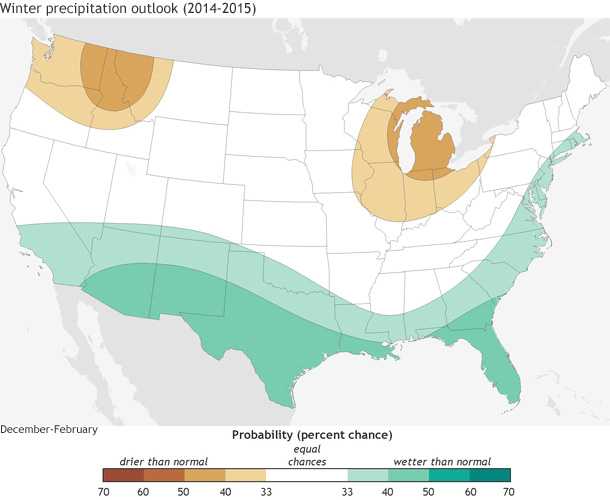
Chances of well above or well below average precipitation. Well above/below means in the upper/lower third of the historical record. White areas have equal chances for above, below, or near-normal precipitaiton. Maps by NOAA Climate.gov based on data from the Climate Prediction Center. Larger version (click image) includes Alaska.