
Image caption
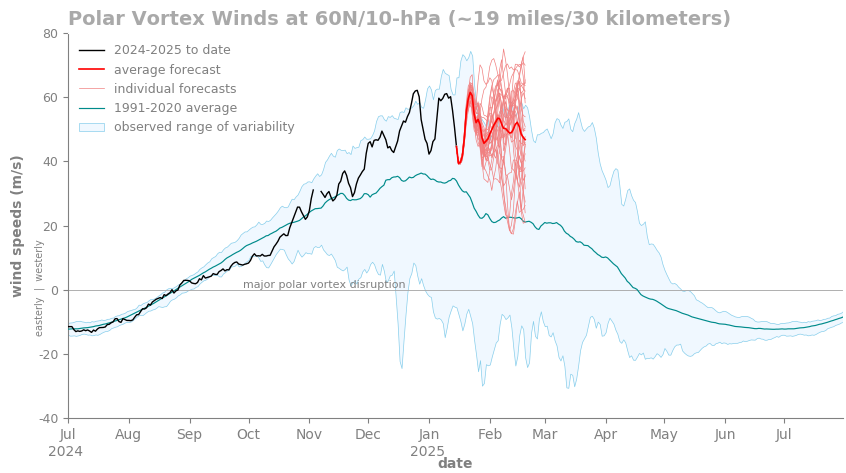
Observed and forecasted (NOAA GEFSv12) wind speed in the polar vortex compared to the natural range of variability (faint blue shading). Since mid-November, the winds at 60 degrees North (the mean location of the polar vortex) have been stronger than normal. According to the GEFSv12 forecast issued on January 15 2025, those winds are forecast to remain stronger than normal for at least the next few weeks (bold red line). NOAA Climate.gov image, adapted from original by Laura Ciasto.