
Image caption
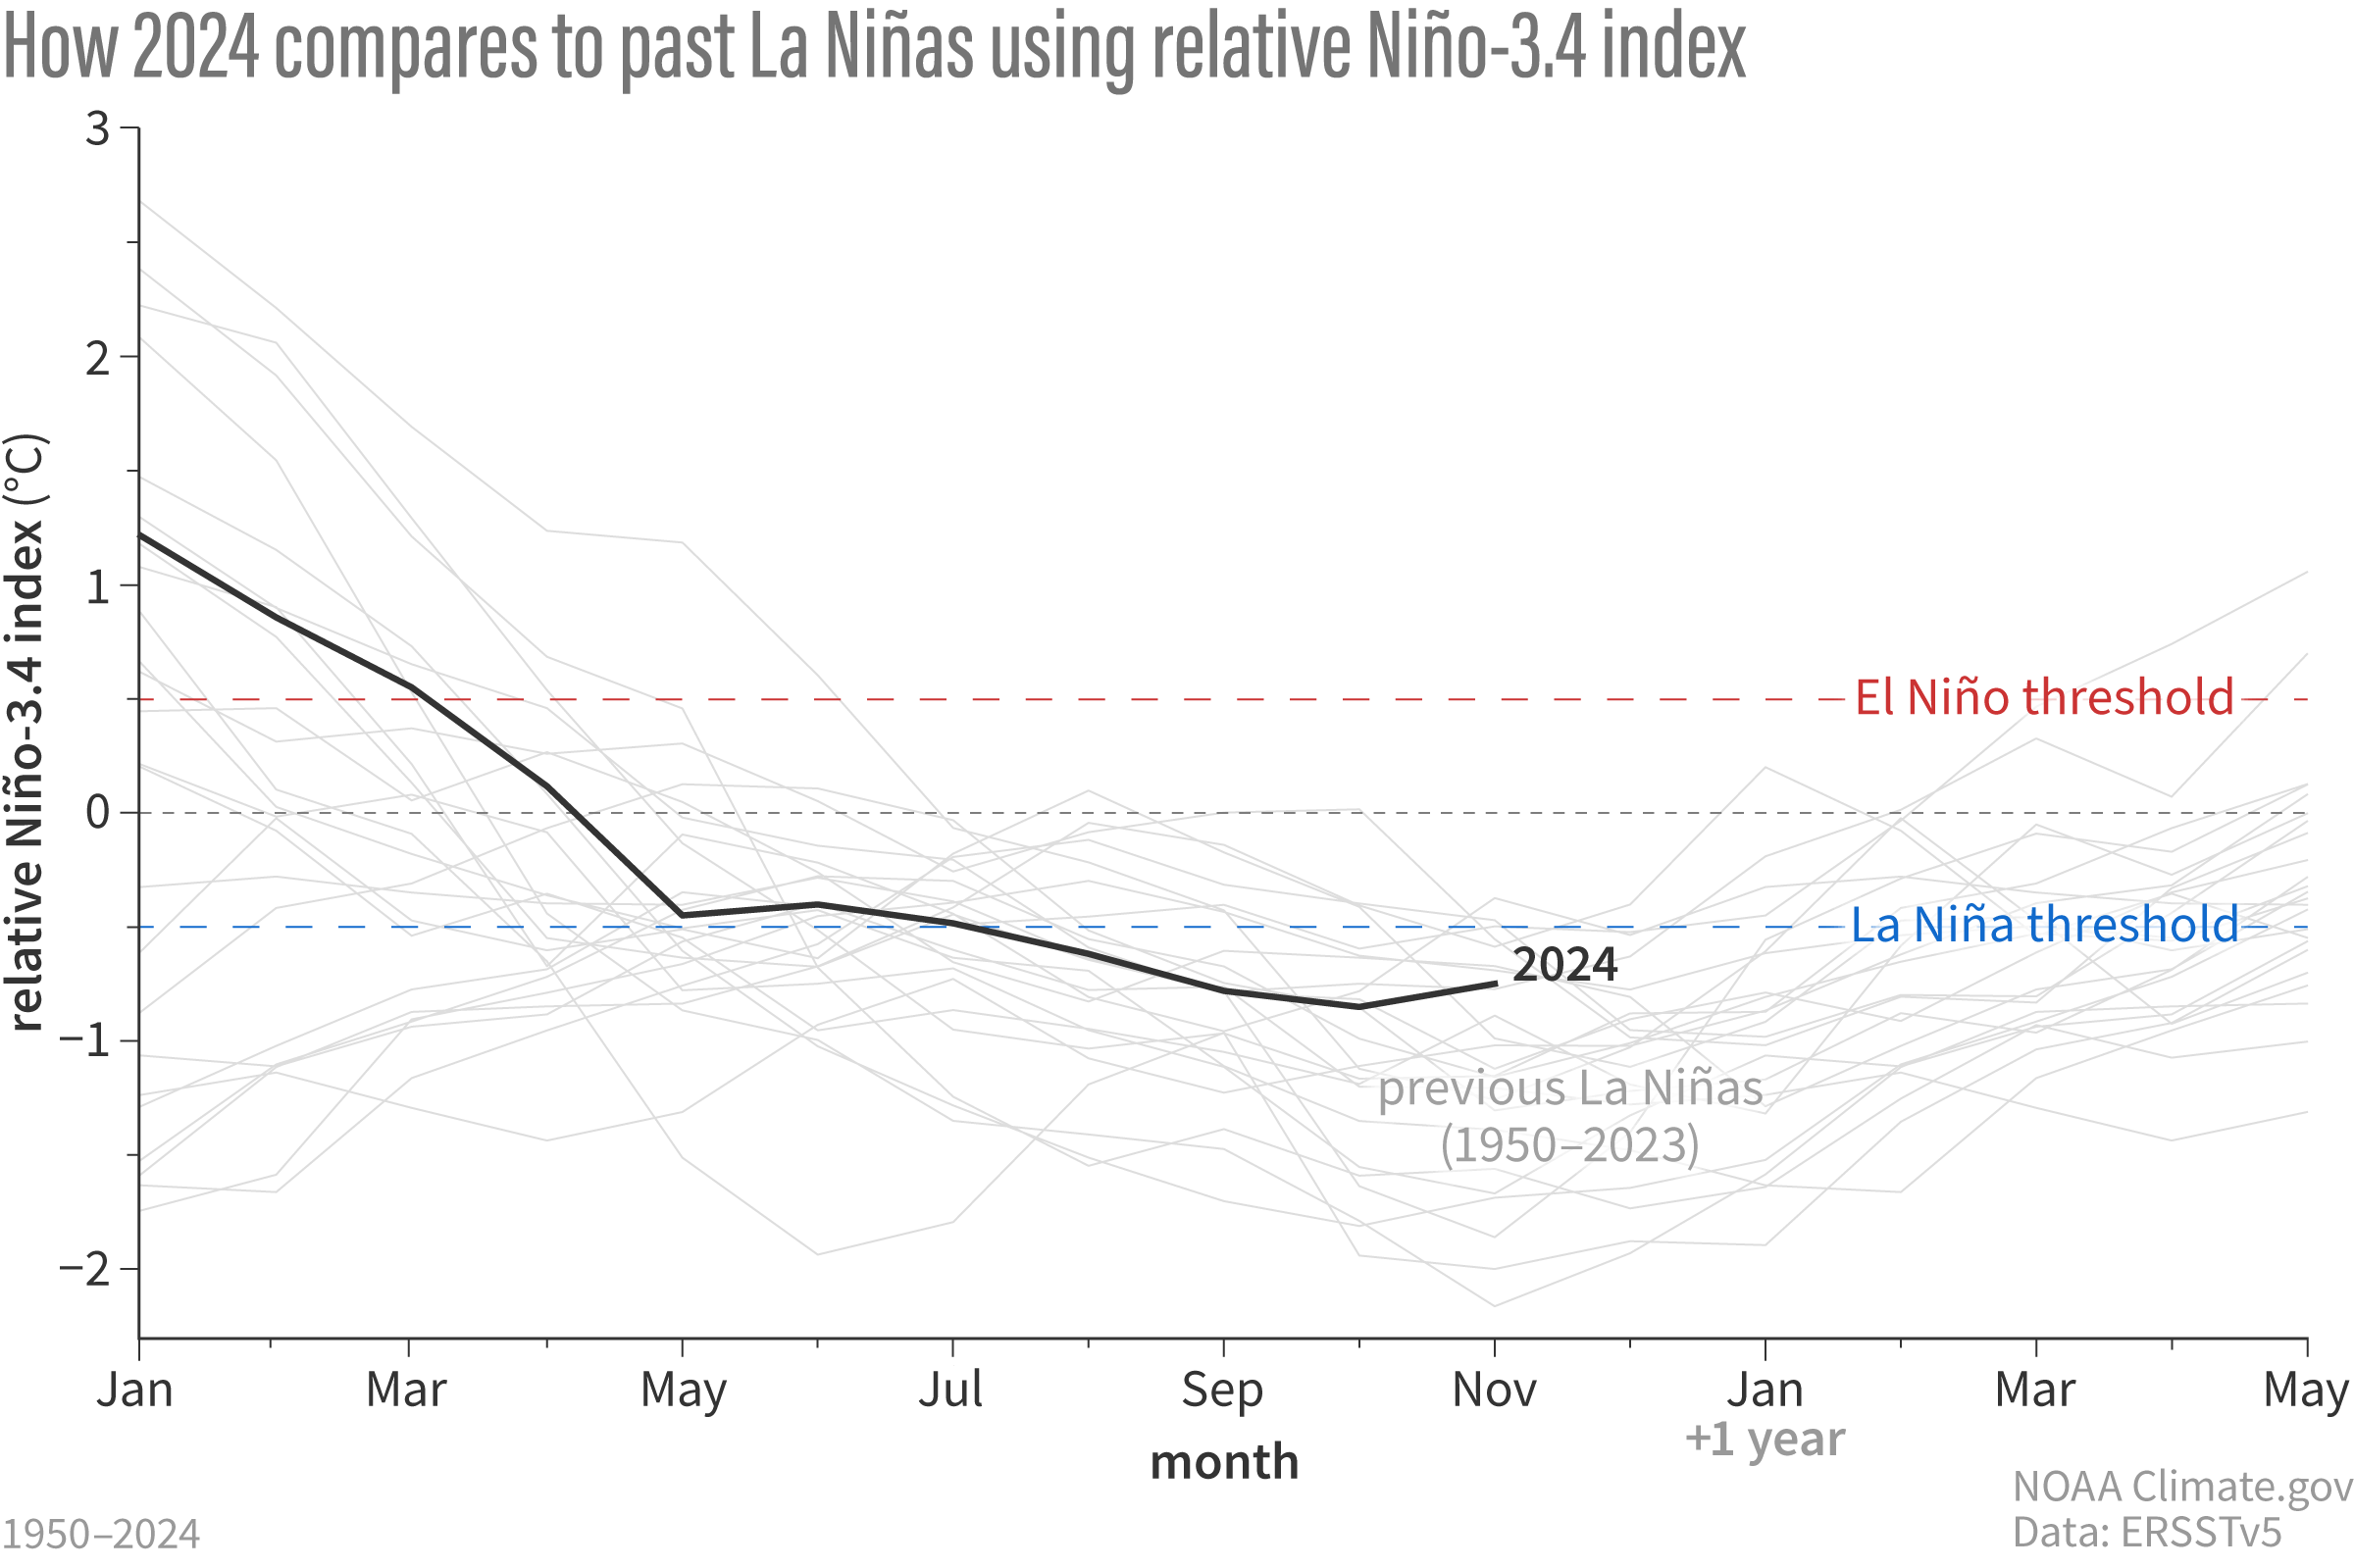
How sea surface temperatures in the Niño-3.4 region of the tropical Pacific changed over the course of all La Niña events since 1950 (gray lines) and 2024 (black line), based on the relative Niño-3.4 calculation. Here, the monthly temperature is compared to the most recent 30-year average, but then the tropical average ocean surface temperature is subtracted, to account for global ocean warmth. By this measure, the La Niña threshold of 0.5 °C has been crossed. The relative Niño-3.4 index is not our official metric, though, and it needs more research. Climate.gov graph, based on data from Michelle L’Heureux.