
Image caption
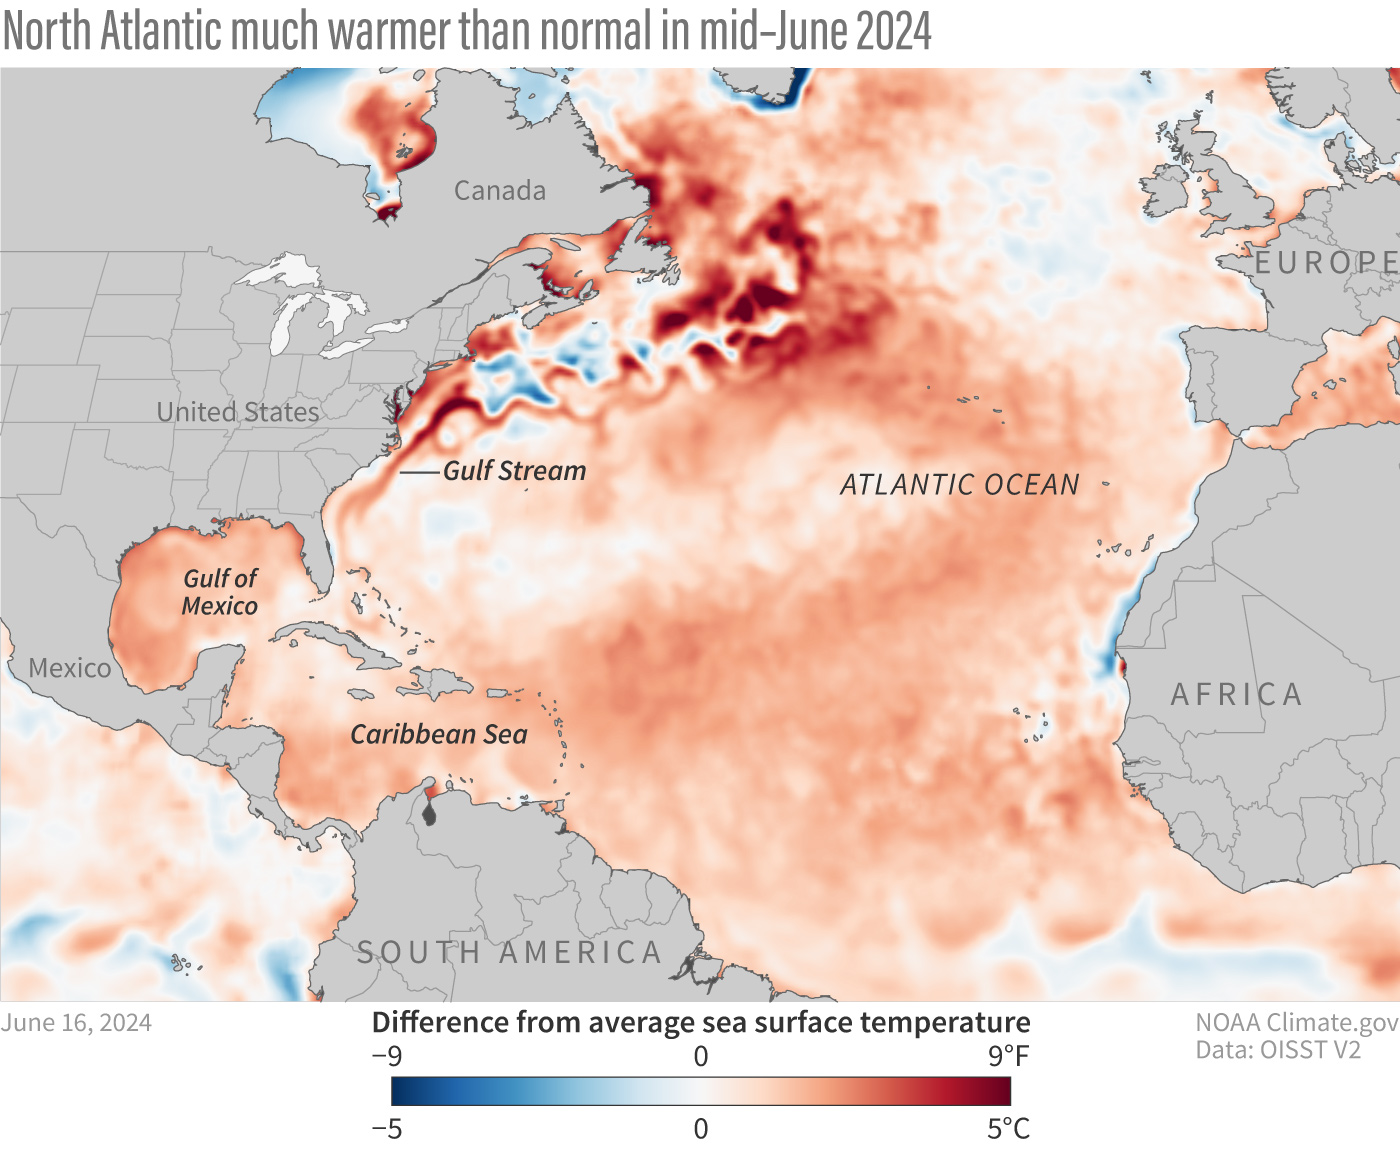
Map showing where sea surface temperatures across the North Atlantic on June 16, 2024, were warmer (red) or cooler (blue) than the 1971-2000 average (white). Image by NOAA Climate.gov, based on NOAA's OI SST V2 High Resolution Dataset.
Map showing where sea surface temperatures across the North Atlantic on June 16, 2024, were warmer (red) or cooler (blue) than the 1971-2000 average (white). Image by NOAA Climate.gov, based on NOAA's OI SST V2 High Resolution Dataset.