
Image caption
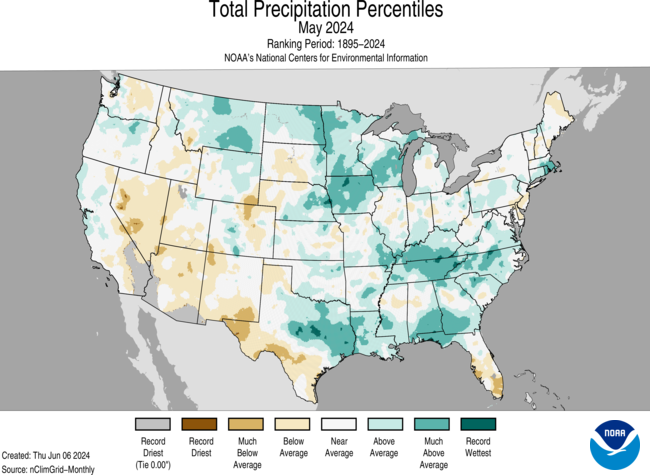
Total precipitation (rain and snow) across the United States sorted by percentiles. On balance, more of the country was wetter than average (blue-greens) than drier than average (tan to brown). NOAA NCEI map.
Total precipitation (rain and snow) across the United States sorted by percentiles. On balance, more of the country was wetter than average (blue-greens) than drier than average (tan to brown). NOAA NCEI map.