
Image caption
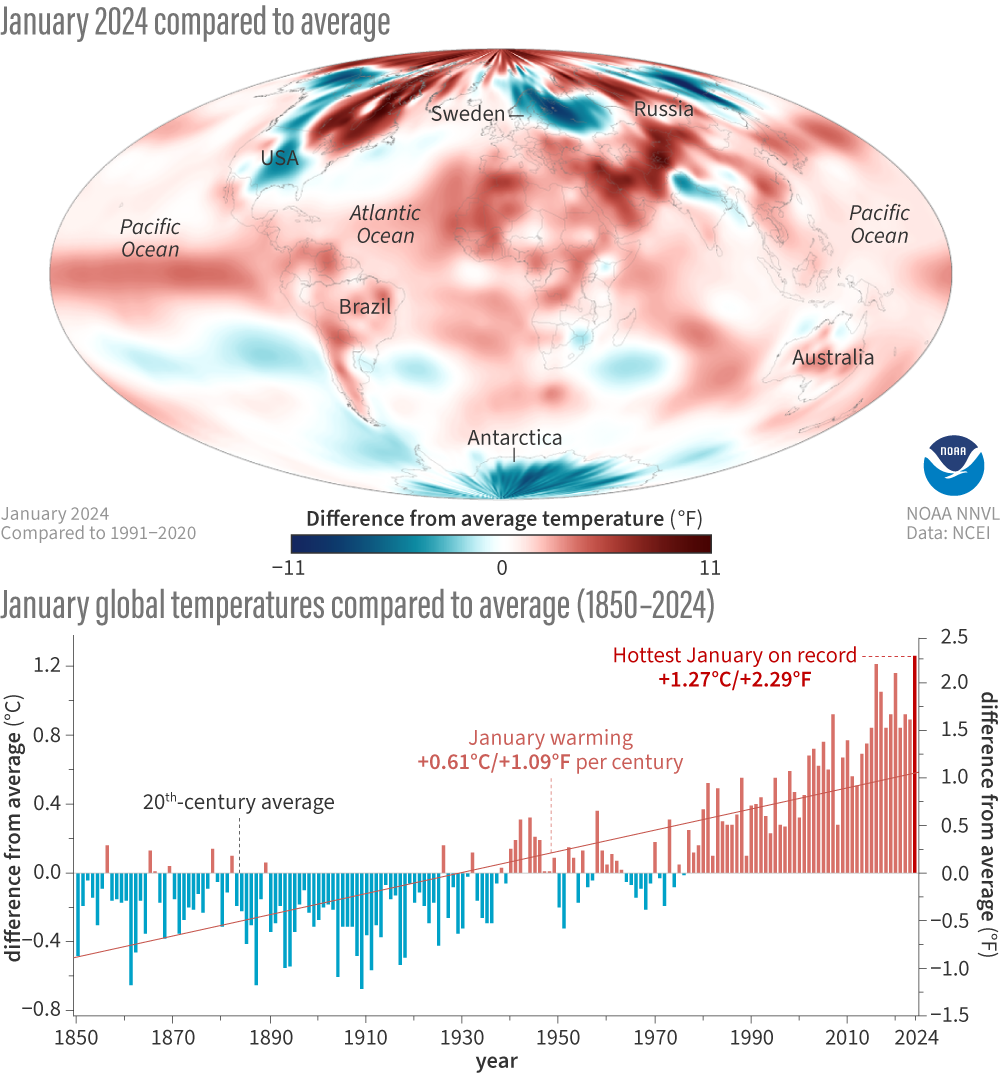
(map) Global surface temperatures for January 2024 compared to the 1991-2020 average, showing a few colder-than-average locations (blue) scattered among mostly warmer-than-average temperatures (red). (graph) January temperatures each year from 1850-2024 compared to the 20th-century average. It's been several decades since we've had a January that was colder than average (blue bars, below the zero line). January 2024 (final red bar) was the warmest January on record. Januarys are getting warmer at a rate of 1.09 ˚F (0.61 ˚C) per century. NOAA Climate.gov images, based on data from NOAA National Centers for Environmental Information (NCEI).