
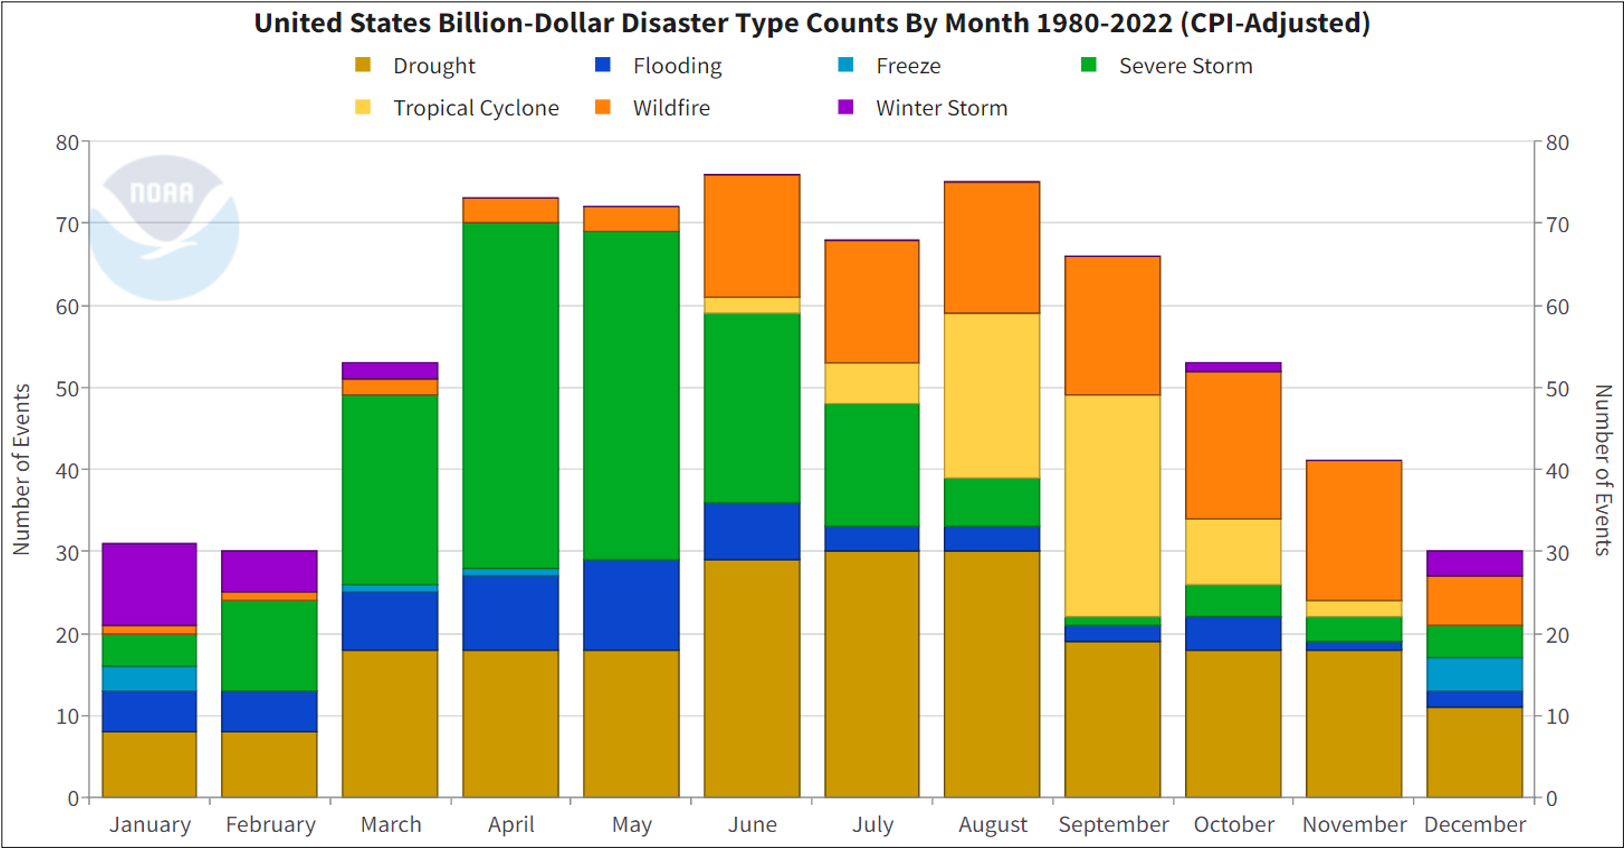
Image caption
The monthly climatology of U.S. billion-dollar weather and climate disasters from 1980 to 2022, showing which months have the greater frequency of disasters (height of bar) and which types of events (colors) are most likely to occur in a given month. NOAA NCEI image.