
Image caption
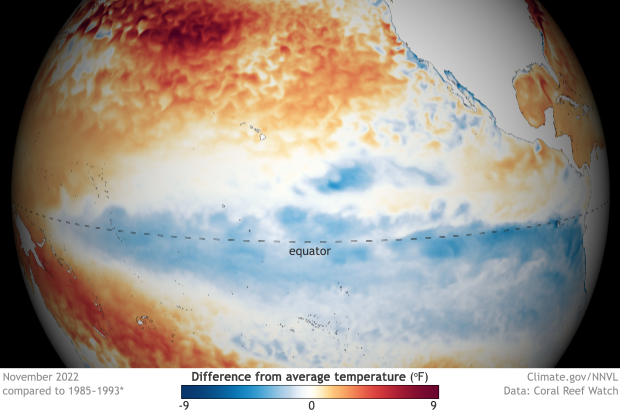
Difference from average sea surface temperature across the tropical Pacific Ocean in November 2022. The broad swath of cooler-than-average temperatures (blue) across the central and eastern part of the basin indicates that La Niña—the cool phase of the El Niño-Southern Oscillation climate pattern—was underway. NOAA Climate.gov image, based on Coral Reef Watch data.