This website is an ARCHIVED version of NOAA Climate.gov as of June 25, 2025. Content is not being updated or maintained, and some links may no longer work.
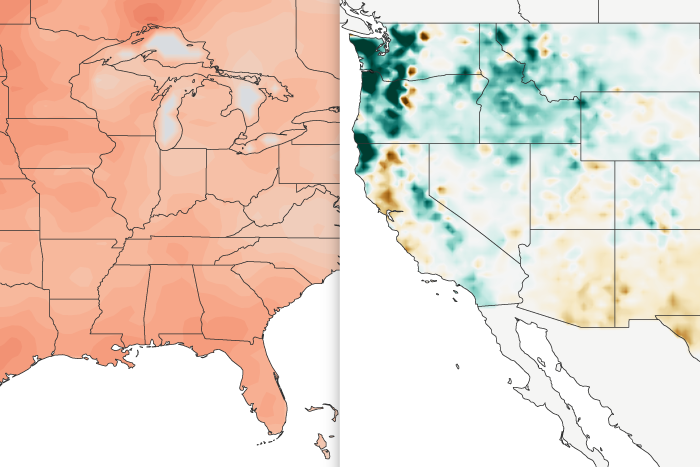
Alternate Text: Side-by-side U.S. maps showing typical temperature (left) and precipitation (right) patterns during fall and early winter during La Niña
