
Image caption
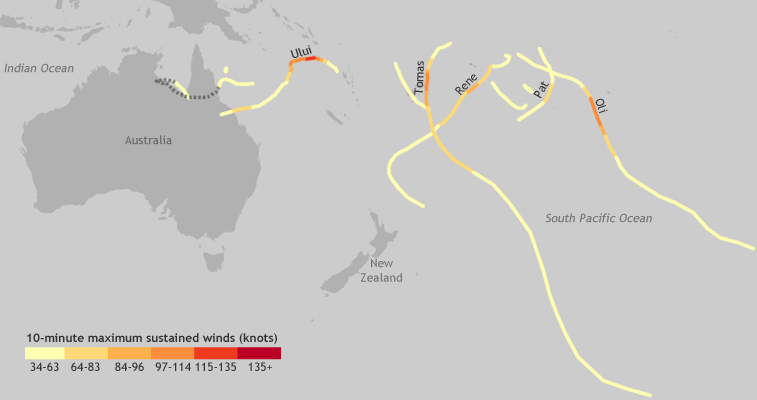
This map shows the path and 10-minute maximum sustained wind speeds of all tropical cyclones in the Southwest Pacific basin during the 2009/2010 season. Paths with names were major tropical cyclones. Dashed line indicates wind speeds below 34 knots. Map by Hunter Allen, based on International Best Track Archive for Climate Stewardship-World Meteorological Organization (IBTrACS-WMO) data.