
Image caption
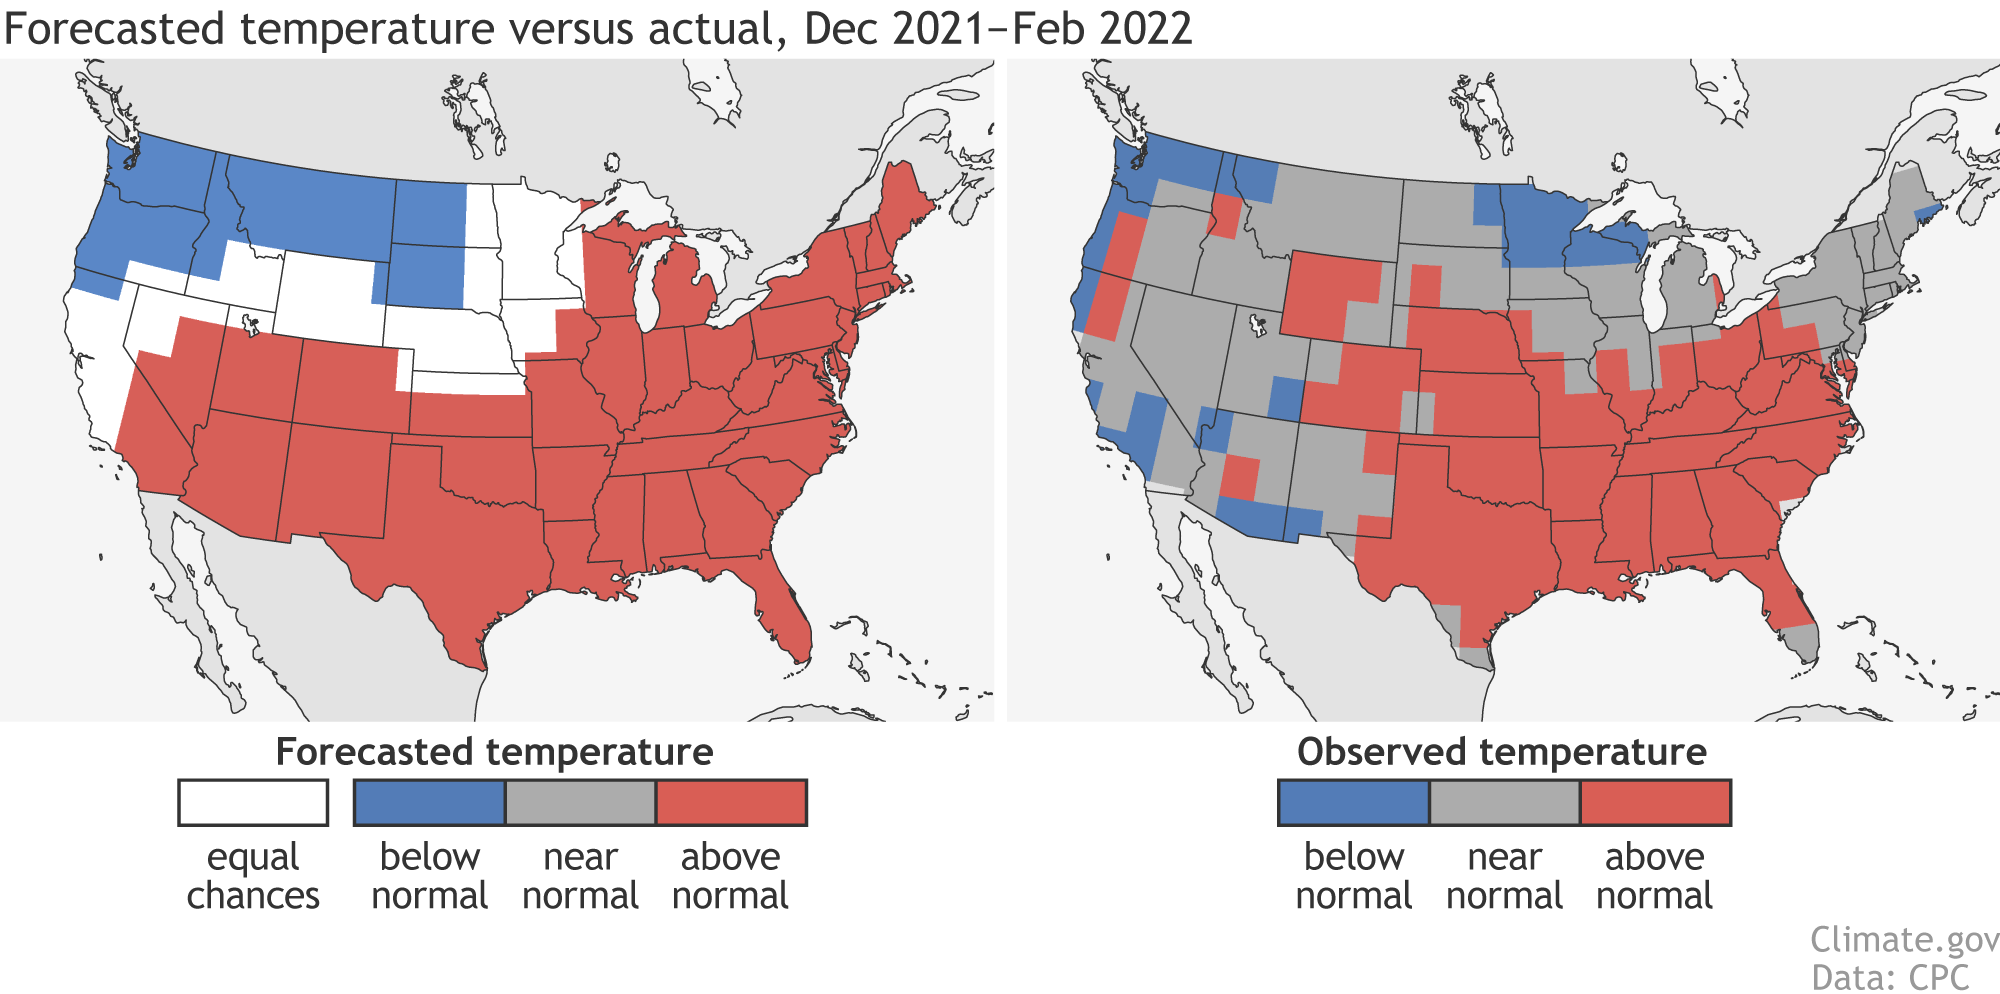
(left) Temperature forecast for December-February 2021-22, made in mid-November. The colors show the forecast category with the highest probability. White areas are where all three outcomes (warm, cool, or average) were equally likely (each had a 33.3% chance of happening). (right) Observed temperature category for December-February 2021-22. Climate.gov image based on CPC data.