
Image caption
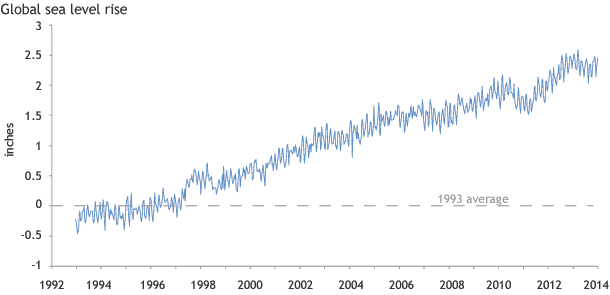
Global sea level from 1993 through 2013 compared to 1993-2012 average, based on AVISO data. Graph adapted from Plate 1.1, panel v, in State of the Climate in 2013.
Global sea level from 1993 through 2013 compared to 1993-2012 average, based on AVISO data. Graph adapted from Plate 1.1, panel v, in State of the Climate in 2013.