
Image caption
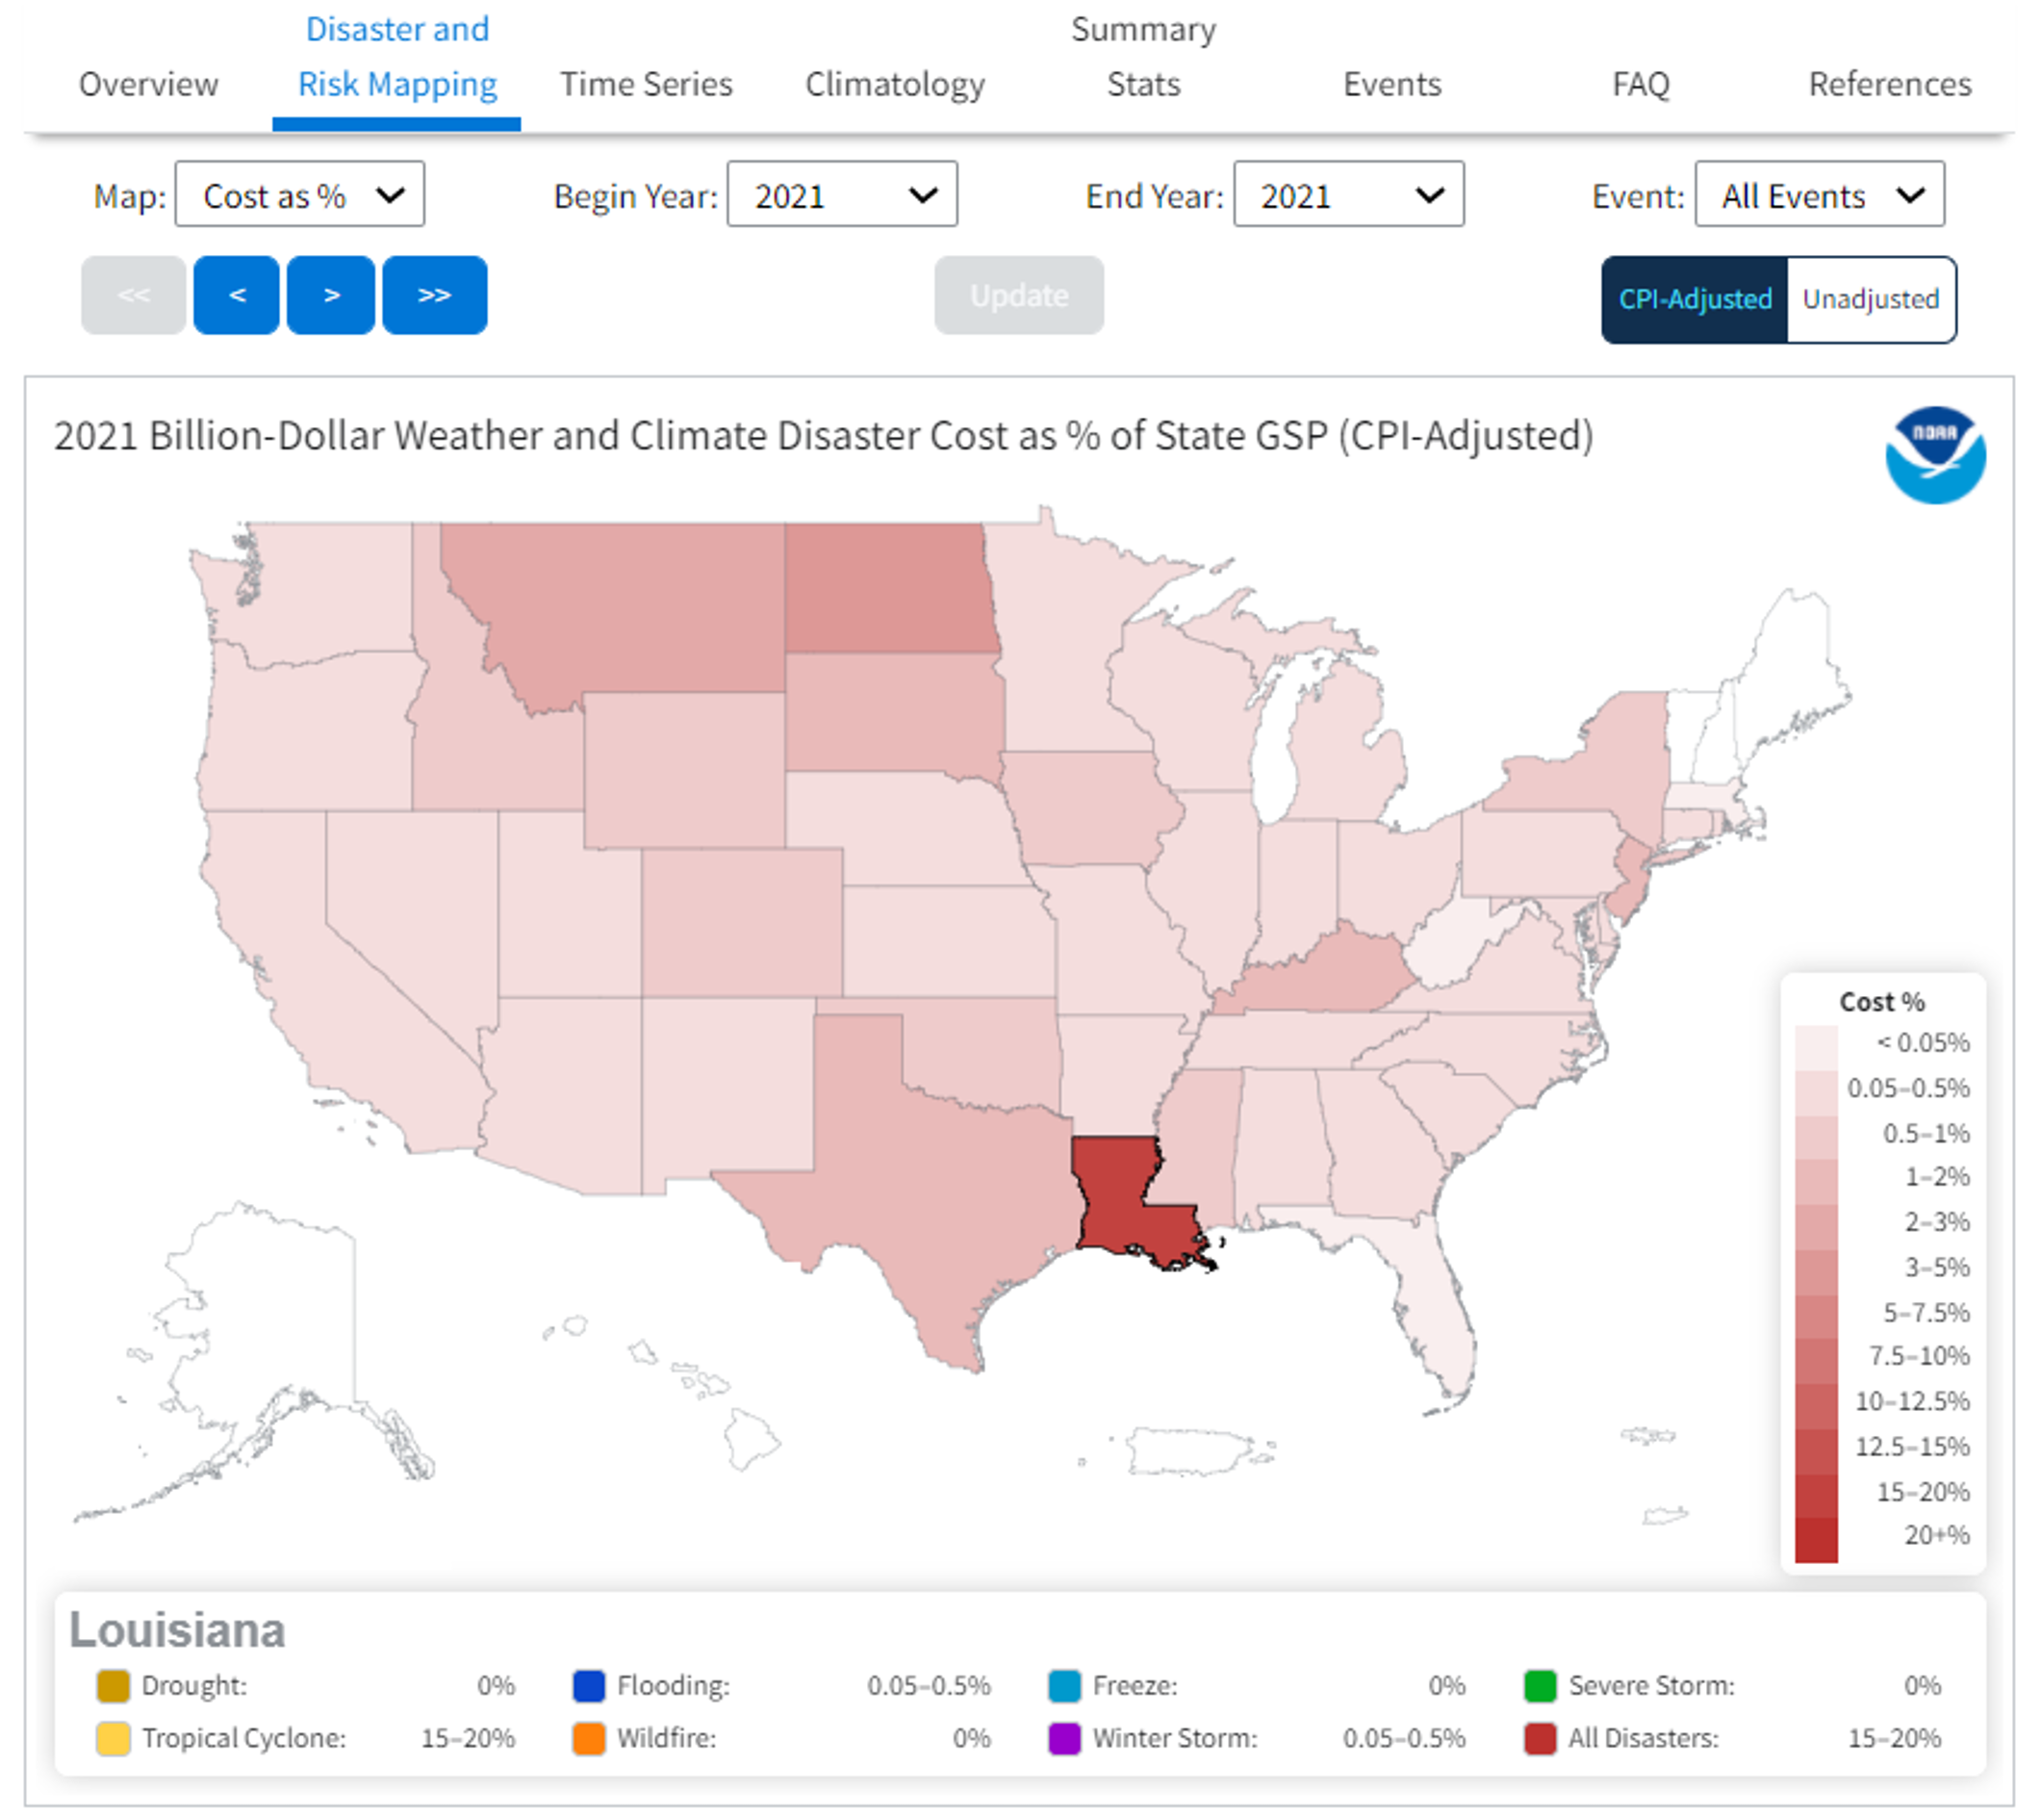
Screenshot of a map the US showing billion-dollar disasters costs as a percentage of each state's gross domestic product (GDP) over the historical record from 1980-2021.
Screenshot of a map the US showing billion-dollar disasters costs as a percentage of each state's gross domestic product (GDP) over the historical record from 1980-2021.