
Image caption
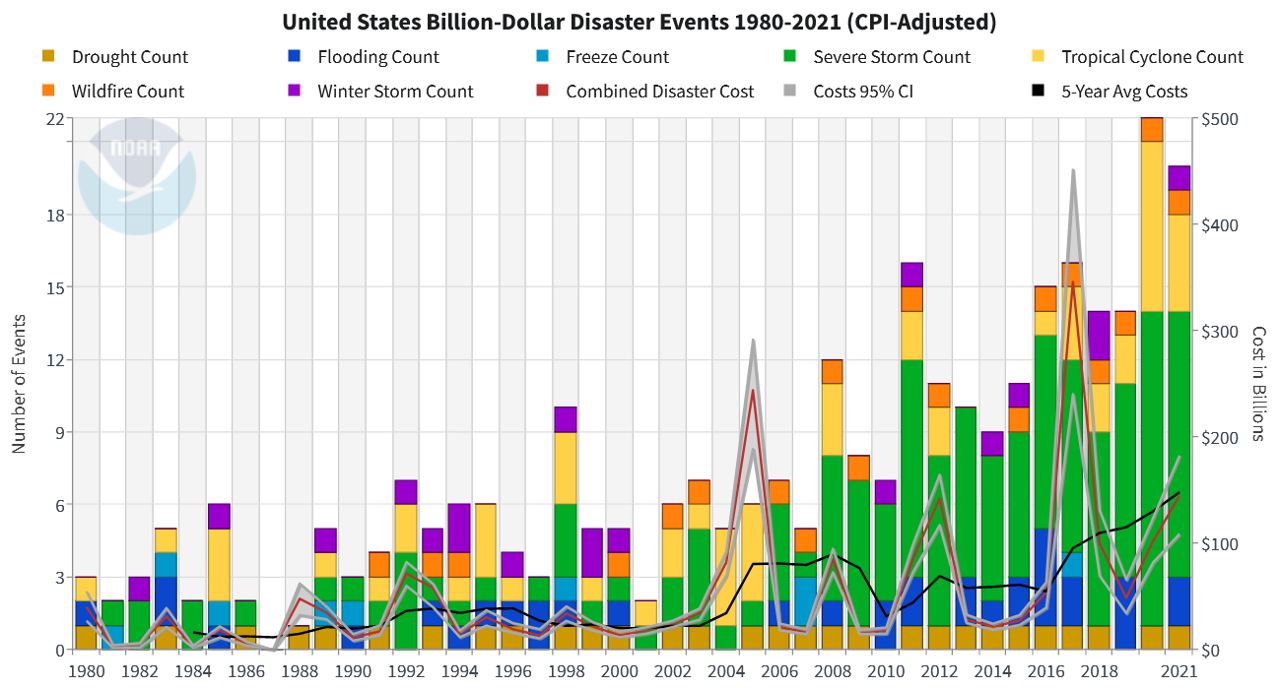
The history of billion-dollar disasters in the United States each year from 1980 to 2021, showing event type (colors), frequency (left-hand vertical axis), and cost (right-hand vertical axis.) The number and cost of weather and climate disasters is rising due to a combination of population growth and development along with the influence of human-caused climate change on some type of extreme events that lead to billion-dollar disasters. NOAA NCEI.