
Image caption
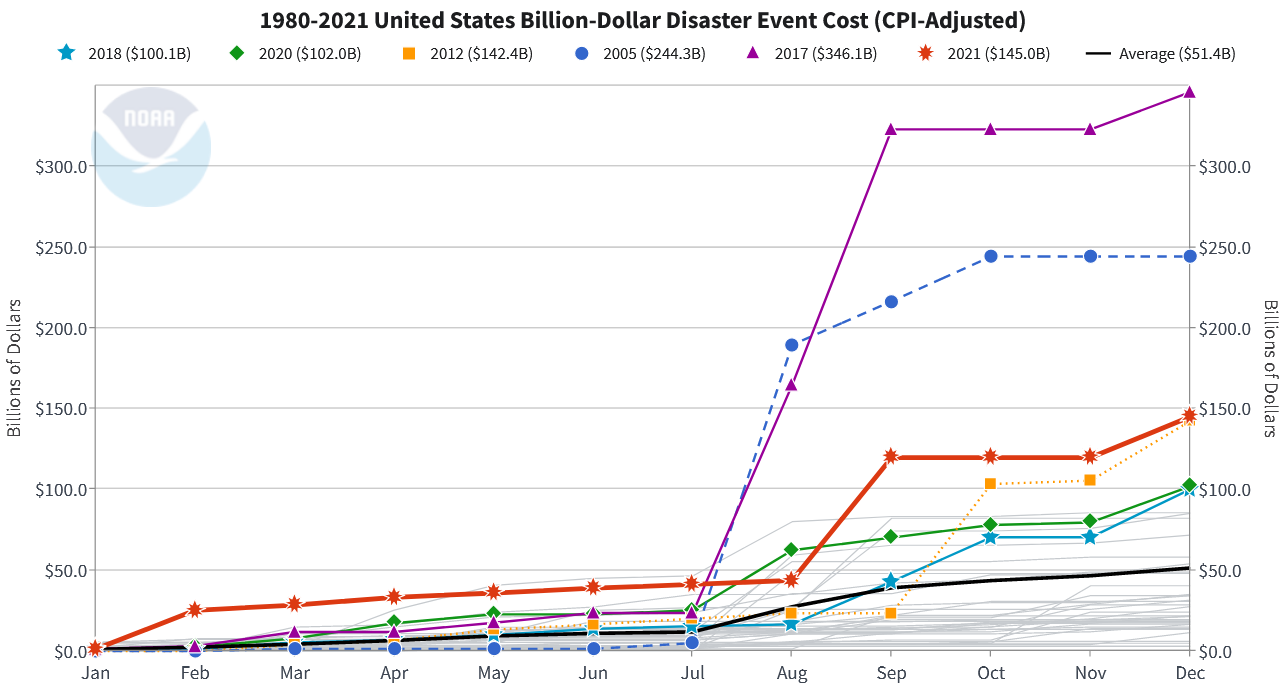
Month-by-month accumulation of estimated costs of each year's billion-dollar disasters, with colored lines showing 2021 (red) and the previous top-5 costliest years. Other years are light gray. 2021 finished the year in third place for annual costs.