
Image caption
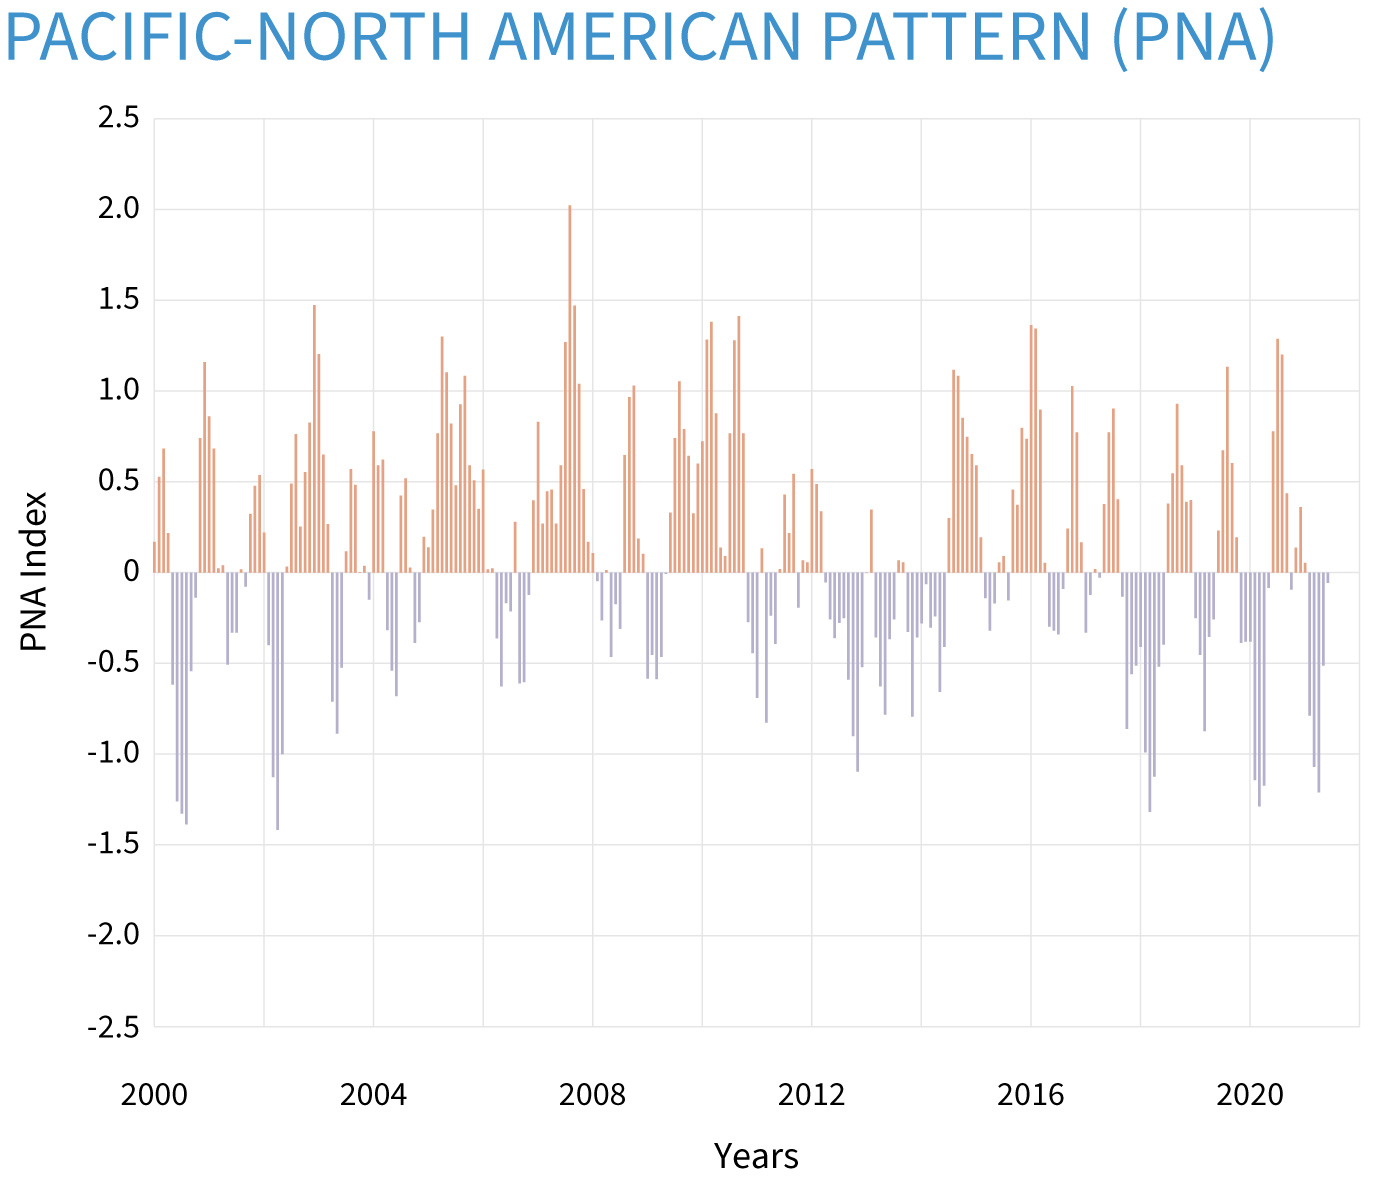
Rolling seasonal (3-month) average values for the Pacific-North America Pattern index. During the positive phase, temperatures across the U.S. tend to be sharply split between a warm West and a cool East. In the negative phase, the West is often cooler than average while the East is warmer than average. NOAA Climate.gov image, based on data from NOAA CPC.