
Image caption
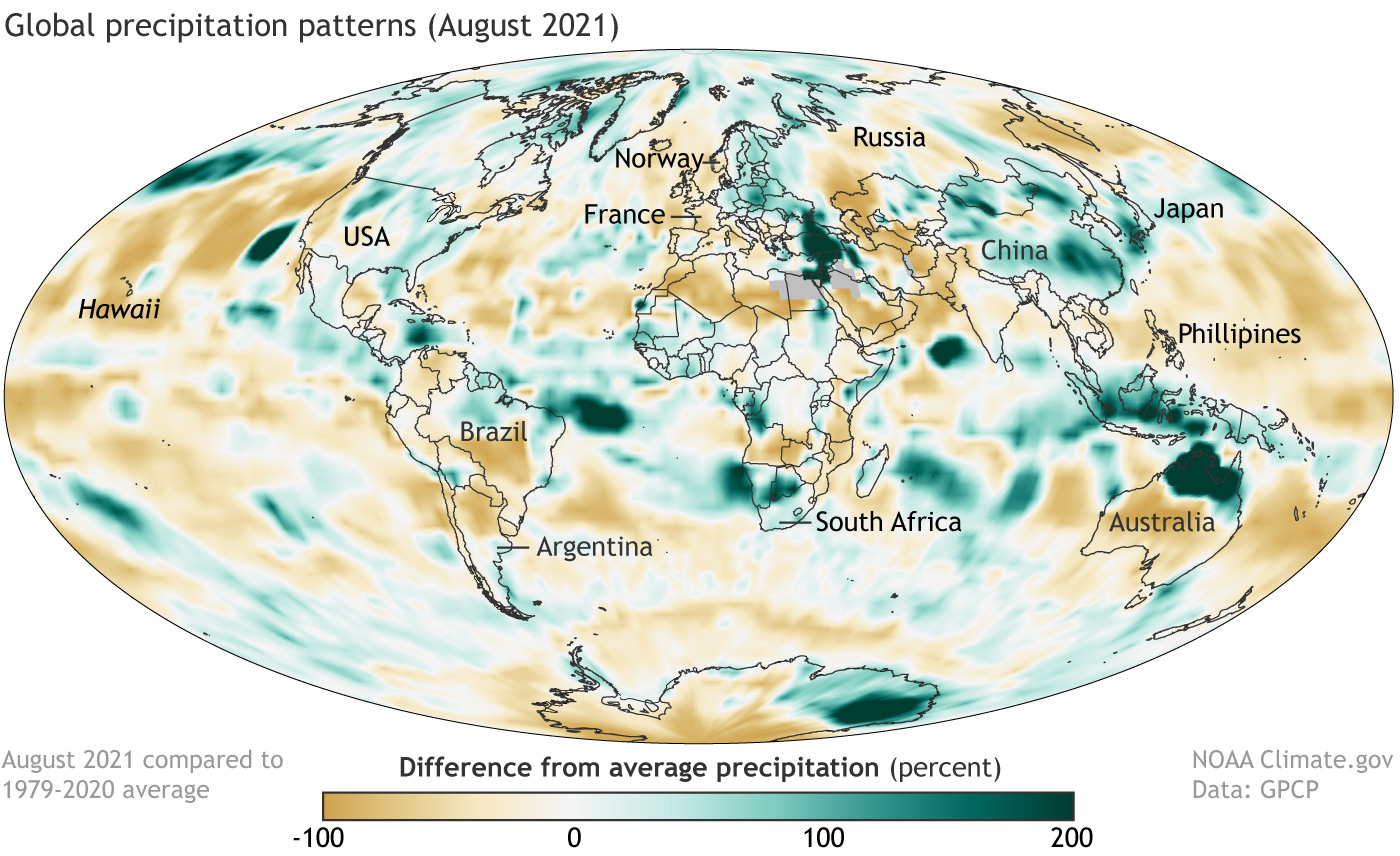
Percent difference from average precipitation in August 2021, based on satellite data from the Global Precipitation Climatology Project. Places that received near their long-term average August precipitation appear white, while places that received up to 200 percent more than their average precipitation are dark green. To see maps of total precipitation and precipitation departures in millimeters per day, see the Precipitation section of the August 2021 Global Climate Report from NCEI.