File name: Global_July2021tempanom_map_graph_large.jpg
Original Resolution (pixels): 1000 × 1000
File Size: 212 KB (MIME Type: image/jpeg)
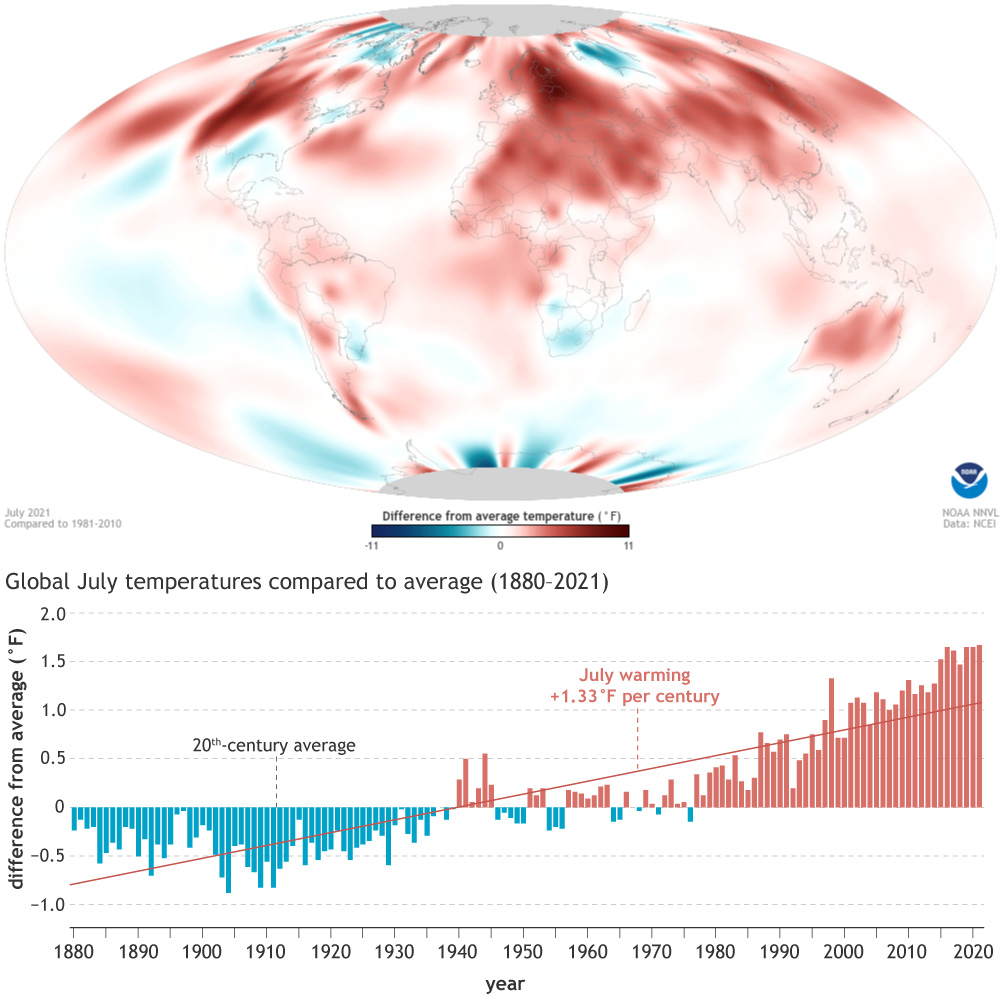
Alternate Text: Map of July global temperature anomaly with bar graph below it showing annual temperature anomalies and trend since 1880
