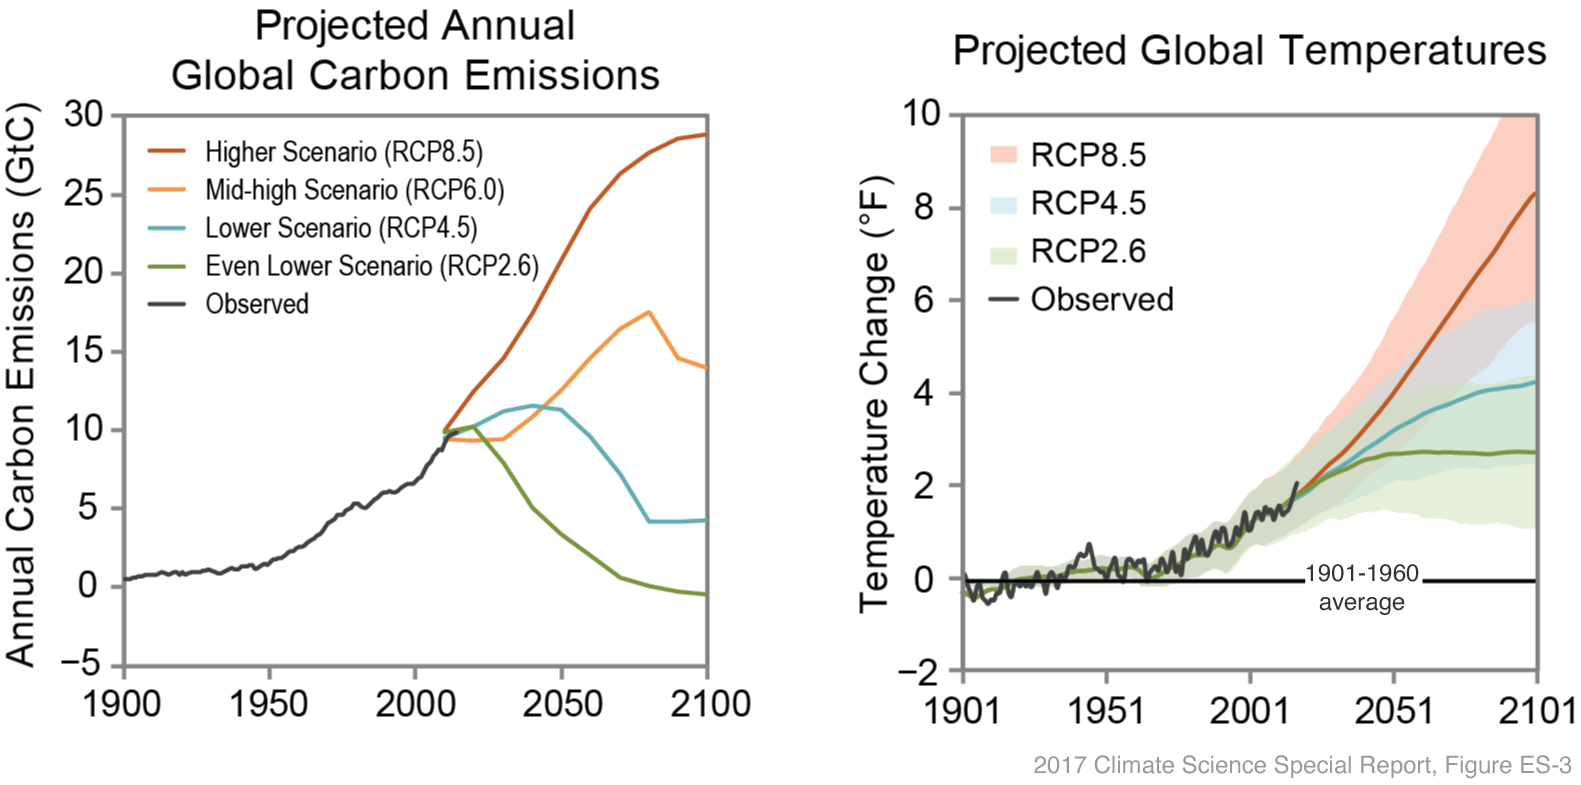
(left) Hypothetical pathways of carbon emissions ("representative concentration pathways," or RCPs) throughout the twenty-first century based on different possible energy policies and economic growth patterns. (right) Projected temperature increase relative to the 1901-1960 average depending on which RCP we eventually follow. Image by Katharine Hayhoe, from the 2017 Climate Science Special Report by the U.S. Global Change Research Program.
