
Image caption
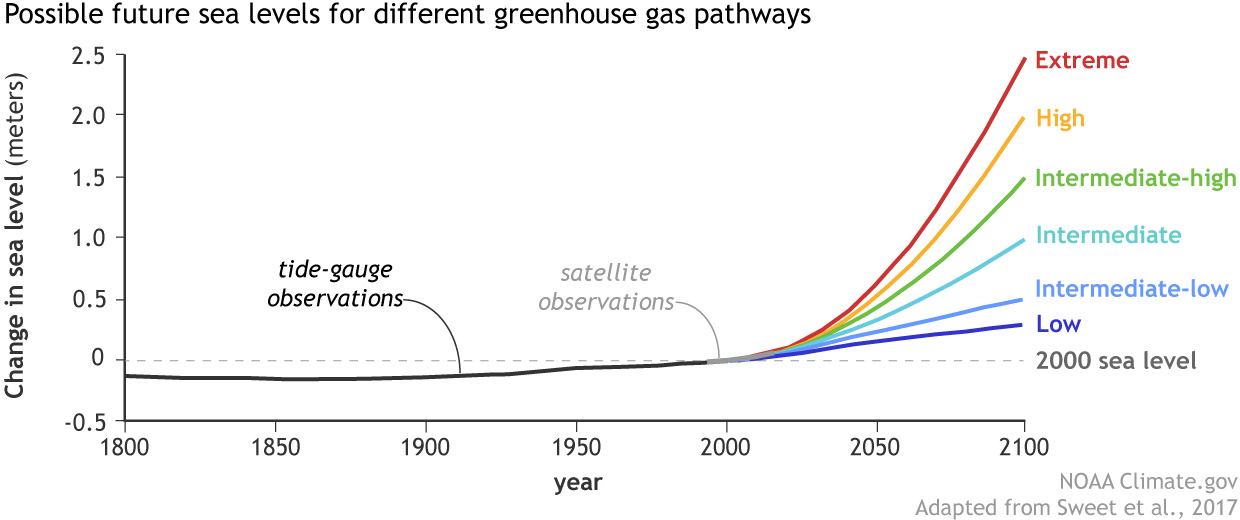
Observed sea level from tide gauges (dark gray) and satellites (light gray) from 1800-2015, with future sea level through 2100 under six possible future scenarios (colored lines). The scenarios differ based on potential future rates of greenhouse gas emissions and differences in the plausible rates of glacier and ice sheet loss. NOAA Climate.gov graph, adapted from Figure 8 in Sweet et al., 2017.