Pilots who are taking off or landing airplanes need current information about wind. Therefore, most airports have reliable observing stations that record wind speed and direction. The Iowa Environmental Mesonet (IEM) gathers wind data from networks around the world; you can use the dataset to explore winds at thousands of locations.
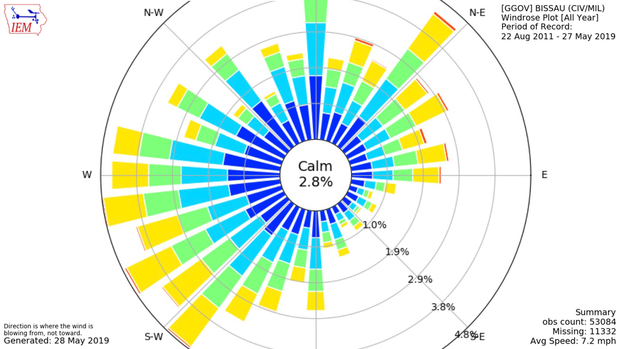
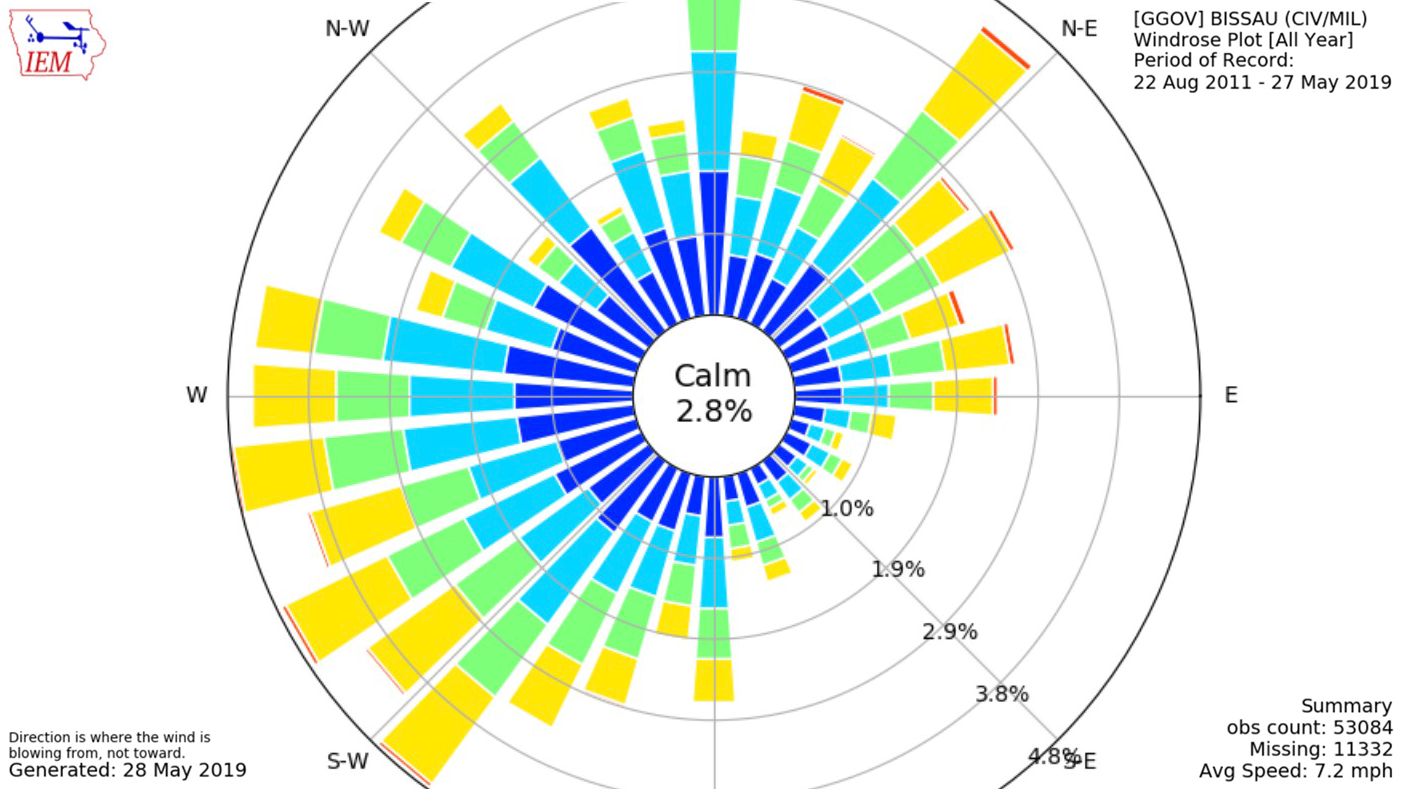
A wind rose is a circular chart that shows where the wind comes from and how fast it blows. Similar to a compass, each "spoke" around the circle indicates a direction the wind blows: the length of each spoke indicates the amount of time the wind blows from that direction. Colors on each spoke indicate the portion of time wind blows at different speeds.
Where do these data come from?
The Iowa Environmental Mesonet (IEM) collects wind data from networks of airport-based observing stations around the world. Many of the stations and networks are similar to Automated Surface Observing Systems (ASOS) installed at airports in the United States. Data collected at each station is available on the IEM website, organized by location or by the organization that administers the station's network.
What can I do with these data?
Choose a station of interest and examine its annual wind rose to understand which way and how fast the wind usually blows.
- Examine monthly wind roses to check if / how the direction or speed of wind changes through the year.
- Generate custom wind roses to explore how wind changes through a day.
Once you feel comfortable interpreting wind roses, compare them to maps of the station location, noting the directional orientation of nearby airport runways.
- Can you predict the orientation of a runway from the location's wind rose, or view a map of an airport runway and predict the overall shape of its annual wind rose?
Check wind roses for a coastal location.
- Identify the best time and place for activities that require plenty of wind. When and where would you expect to be able to fly kites, sail a sailboat, or windsurf?
-
To view prepared wind roses:
- Start at https://mesonet.agron.iastate.edu/sites/locate.php.
- Click the Select by Network dropdown menu and type the name of a state or country in the blank field. For best results, look for the ASOS network for your location of interest. For example: [CA_ASOS] is the ASOS network for California.
- Once you've selected a network, click the Switch Network button.
- To select a station, click any yellow dot on the map, then click the Select Station button.
- Check the tab names in the row just below the location name: click the *Wind Roses tab .
The first wind rose shows winds for the whole year. Scroll down to view plot for every month of the year.
To explore winds at specific times of day, click the *Custom Wind Roses tab.
Multiple controls give you the opportunity to explore winds at very specific times.
- To check winds during a specific part of the day, limit observations to a range of hours. For instance, to explore mid-morning winds, set Start time = 8:00 AM and End time =11:00 AM
- Specify your time period of interest and click Submit.
Custom controls also let you find the average winds for specific intervals over the period of record. If you want to check if winds have increased over time, use the controls to specify a period in the past, then select a similar period in the more recent past for comparison.
Note that this application attempts to generate a wind rose for whatever time period you specify. To minimize the amount of data that the application has to process for initial explorations, the default time period is very short and may not produce a graphic. If you set the request for a large amount of data, it can take up to a few minutes to generate the plot.
-
Data Format(s)TXT (ASCII), CSV, PNG
-
For selected stations, you can access prepared wind roses that characterize winds from 1961-1990.
-
Data TypeLand-based stationEssential Climate VariablesWind speed and direction
-
The site states that in general, data from airports is of good quality and representative of the local surrounding area. However, the archive does contain errors and non representative data, so please use care when using these plots.
 Click to see more detail
