Data Snapshots Image Gallery
Precipitation - Monthly Outlook
- Dataset Details
- Monthly images from 2013 to present
- Download Directories
- Click on any of the links below to view a directory listing of images and assets related to this dataset.
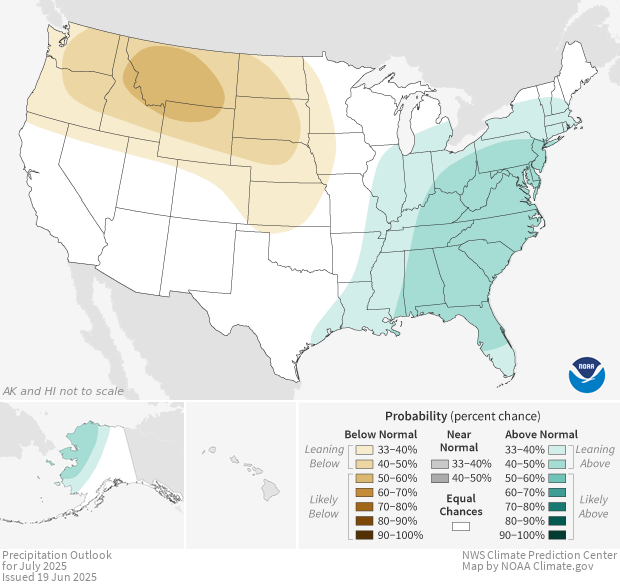
Colors show where total precipitation has an increased chance of being higher or lower than usual during the next month. The darker the shading, the greater the chance for the indicated condition. White areas have equal chances for precipitation totals that are below, near, or above the long-term average (median) for the month.
Climate scientists base future climate outlooks on current patterns in the ocean and atmosphere. They examine projections from climate and weather models and consider recent trends. They also check historical records to see how much precipitation fell when patterns were similar in the past.
Colors on the map show experts’ level of confidence in their forecasts for above or below median precipitation totals. Each location on the map has some chance to receive precipitation that ranks in the bottom, middle, or top third of records from the previous three decades. White areas have equal chances for each condition. Colors show where the odds for one of the three conditions are higher than for the other two.
A common mistake is to interpret these maps as predictions of precipitation amounts. However, dark green areas are not predicted to receive more precipitation than light green areas. The dark green areas simply have a higher likelihood of receiving above median amounts of rain than the light green areas do. Similarly, dark brown areas are not predicted to receive less rain than light brown areas.
Keep in mind that outlooks show the most likely condition for each region, not the only possible outcome.
Water managers, farmers, and forestry officials have an intense interest in precipitation outlooks. They use them to help make decisions about water resources, irrigation, and fire-fighting resources. Flood forecasters also use these outlooks. They want to know as early as possible if an area is likely to receive more precipitation than usual.
Data Snapshots are derivatives of existing data products: to meet the needs of a broad audience, we present the source data in a simplified visual style. NOAA's Climate Prediction Center (CPC) produces the source images for monthly precipitation outlooks. To produce our images, we run a set of scripts that access map layers from CPC, re-project them into desired projections at various sizes, and output them with a custom color bar.
CPC issues monthly outlooks one-half month before the beginning of the month of interest. On the day before the new month begins, experts update the outlook for the upcoming month. Each monthly outlook in Data Snapshots shows the date the outlook was issued.
Outlooks that include Alaska are available: while displaying an outlook of interest, click the Download button, select Full Resolution Assets, and then click OK
References
One-Month to Three-Month Climate Outlooks.
http://www.cpc.ncep.noaa.gov/products/forecasts/
Current Outlook Discussion
http://www.cpc.ncep.noaa.gov/products/predictions/long_range/fxus07.html
- Data Provider
- Climate Prediction Center
- Source Data Product
- CPC One-month Outlook Precipitation Probability
- Access to Source Data
- FTP access to .shp files
- Reviewer
- Mike Halpert, Climate Prediction Center
