1881,-0.09
1882,-0.10
1883,-0.18
1884,-0.27
1885,-0.25
1886,-0.24
1887,-0.28
1888,-0.13
1889,-0.08
1890,-0.34
1891,-0.25
1892,-0.30
1893,-0.33
1894,-0.31
1895,-0.24
1896,-0.09
1897,-0.10
1898,-0.27
1899,-0.15
1900,-0.07
1901,-0.15
1902,-0.25
1903,-0.37
1904,-0.45
1905,-0.28
1906,-0.21
1907,-0.38
1908,-0.43
1909,-0.44
1910,-0.40
1911,-0.44
1912,-0.34
1913,-0.32
1914,-0.14
1915,-0.09
1916,-0.32
1917,-0.39
1918,-0.30
1919,-0.25
1920,-0.23
1921,-0.16
1922,-0.24
1923,-0.25
1924,-0.24
1925,-0.18
1926,-0.07
1927,-0.17
1928,-0.18
1929,-0.33
1930,-0.11
1931,-0.06
1932,-0.12
1933,-0.26
1934,-0.11
1935,-0.16
1936,-0.12
1937,-0.01
1938,-0.02
1939,0.01
1940,0.16
1941,0.27
1942,0.11
1943,0.10
1944,0.28
1945,0.18
1946,-0.01
1947,-0.04
1948,-0.05
1949,-0.07
1950,-0.15
1951,0.00
1952,0.04
1953,0.13
1954,-0.10
1955,-0.13
1956,-0.18
1957,0.07
1958,0.12
1959,0.08
1960,0.05
1961,0.09
1962,0.10
1963,0.12
1964,-0.14
1965,-0.07
1966,-0.01
1967,0.00
1968,-0.03
1969,0.11
1970,0.06
1971,-0.07
1972,0.04
1973,0.19
1974,-0.06
1975,0.01
1976,-0.07
1977,0.21
1978,0.12
1979,0.23
1980,0.28
1981,0.32
1982,0.19
1983,0.36
1984,0.17
1985,0.16
1986,0.23
1987,0.38
1988,0.39
1989,0.29
1990,0.45
1991,0.39
1992,0.24
1993,0.28
1994,0.34
1995,0.47
1996,0.32
1997,0.51
1998,0.65
1999,0.44
2000,0.42
2001,0.57
2002,0.62
2003,0.64
2004,0.58
2005,0.67
2006,0.64
2007,0.62
2008,0.54
2009,0.64
2010,0.72
2011,0.58
2012,0.64
2013,0.67
2014,0.74
2015,0.93
2016,0.99
2017,0.91
2018,0.83
2019,0.95
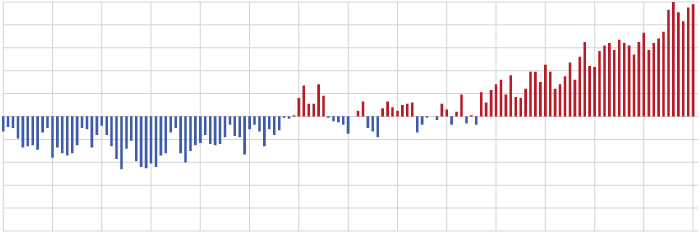
Yearly global temperatures from 1880-2024 compared to the twentieth-century average. Earth's surface temperature has risen 0.14 degrees F per decade since 1880. The rate of warming has more than doubled since 1981. Data from NOAA NCEI.
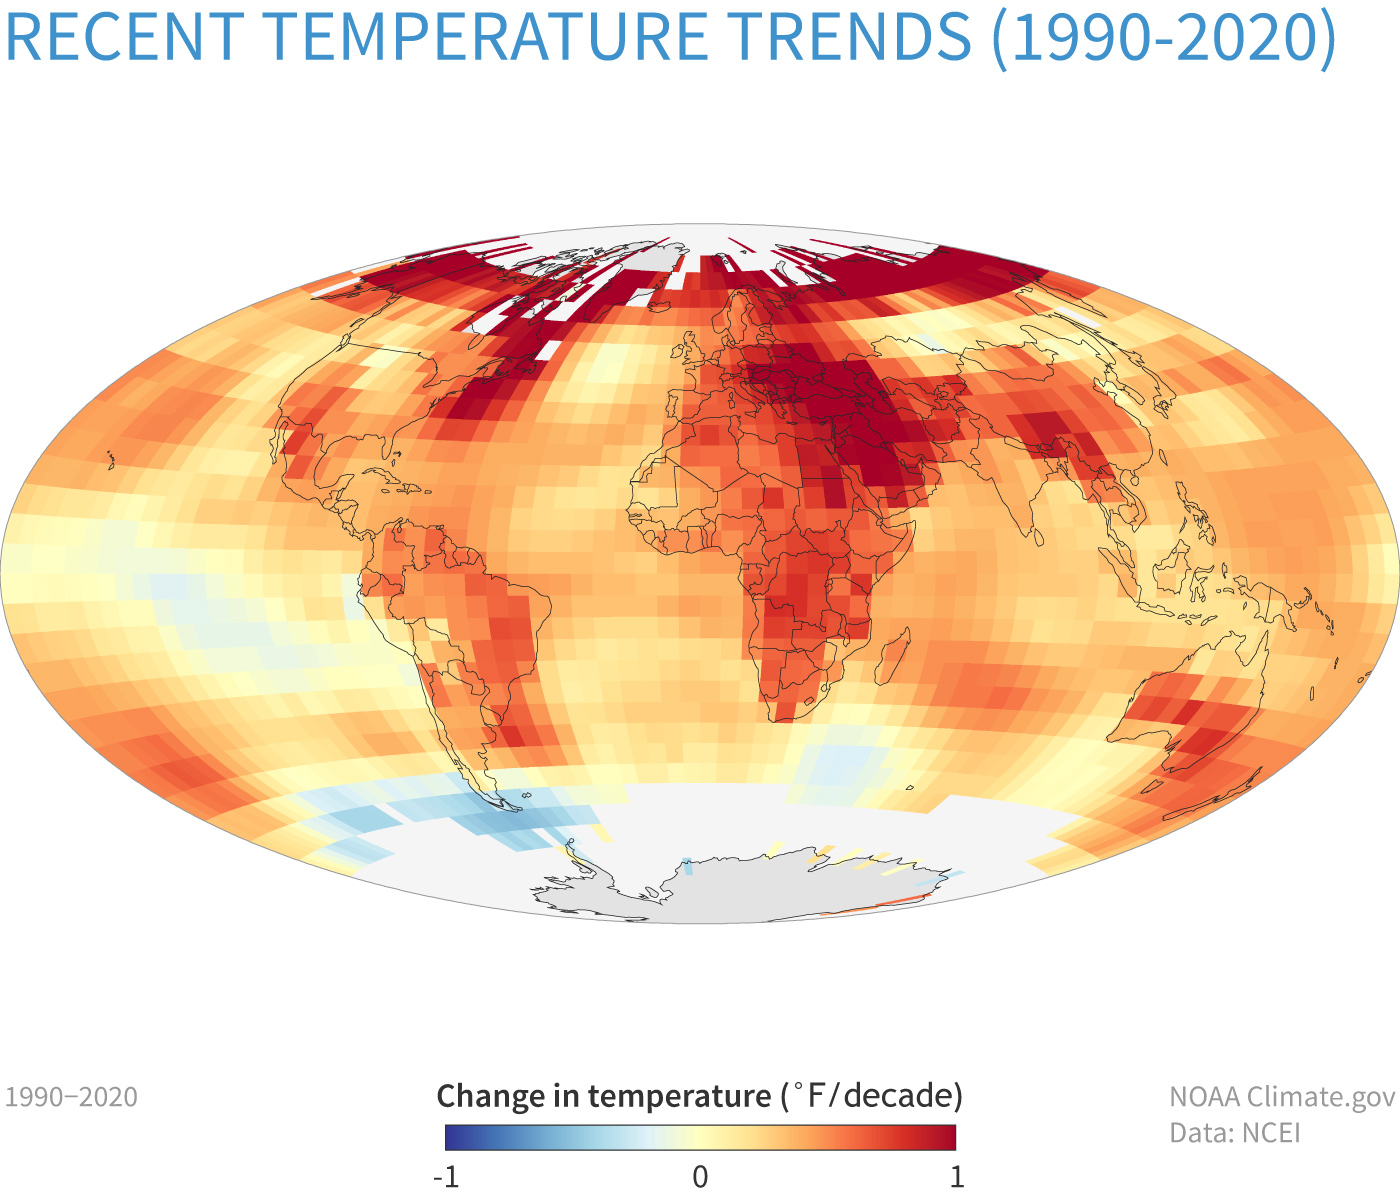
Trends in average surface temperature from 1994-2024. Overall, land areas warmed faster than oceans. The most extreme warming (darkest red) was in the northern high latitudes, and parts of Eurasia and the Middle East. Data from NOAA NCEI.

Yearly surface temperature compared to the 20th-century average from 1880–2022. Blue bars indicate cooler-than-average years; red bars show warmer-than-average years. NOAA Climate.gov graph, based on data from the National Centers for Environmental Information.
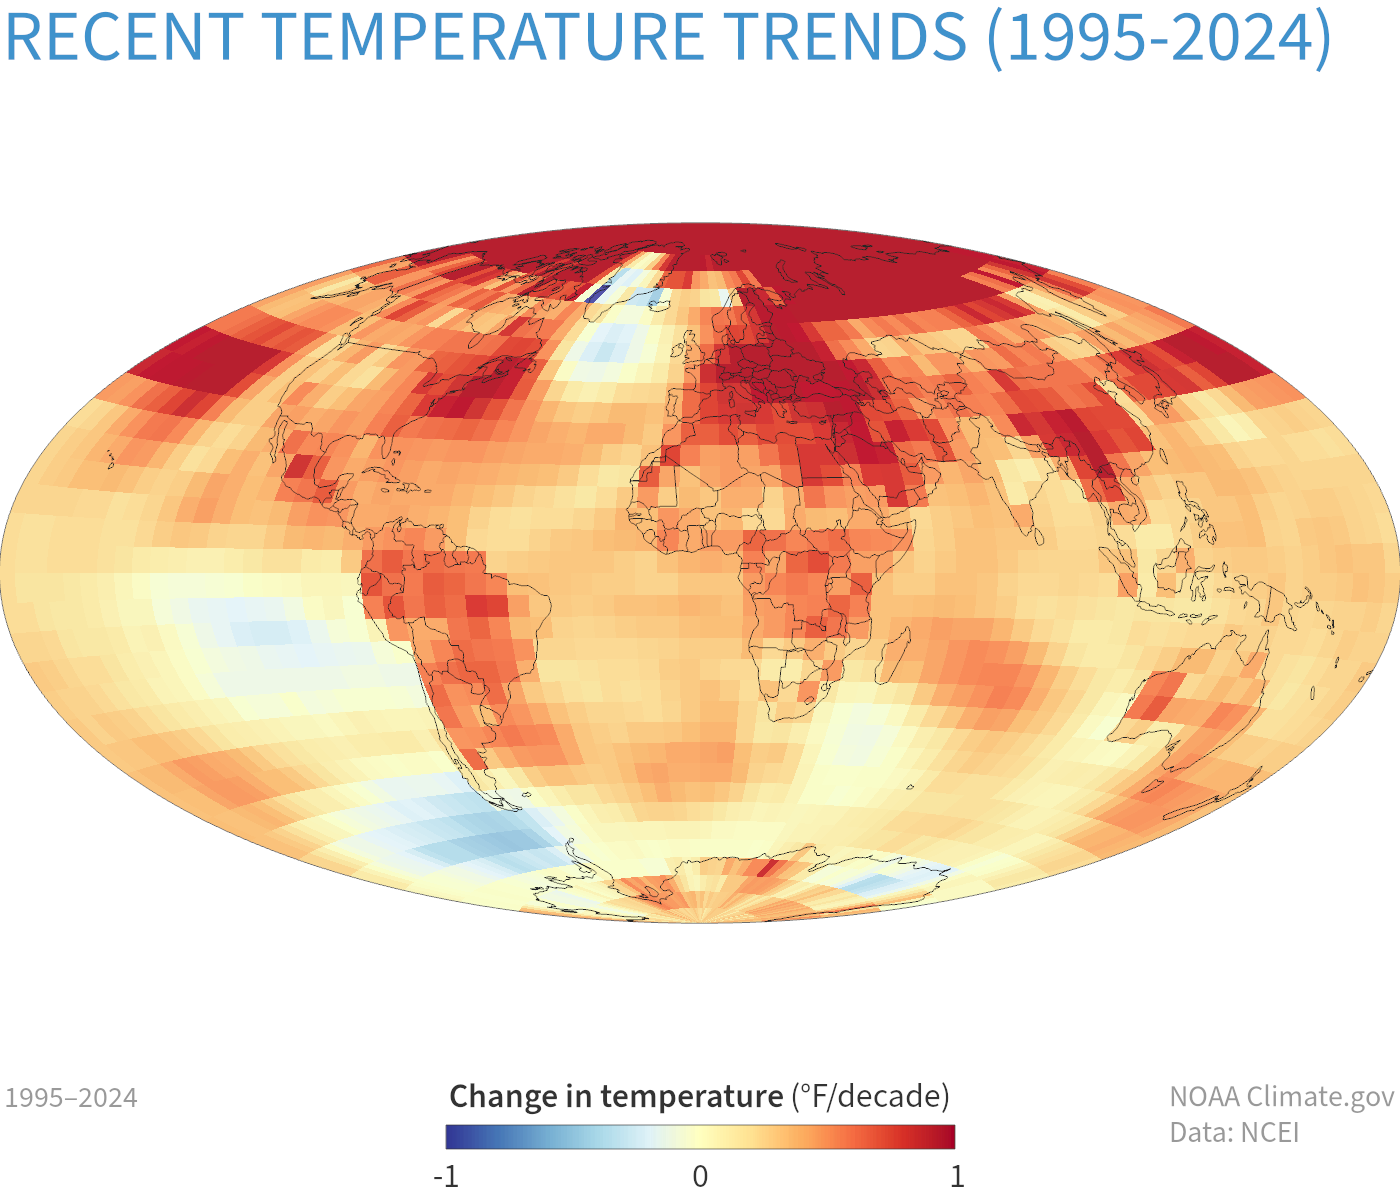
Trends in global average surface temperature between 1994 and 2024 in degrees Fahrenheit per decade. Most of the planet is warming (yellow, orange, red). Only a few locations, most of them in Southern Hemisphere oceans, cooled over this time period. NOAA Climate.gov map, based on data from NOAA Centers for Environmental Information.