1968,-2.358536
1969,0.992292
1970,2.732607
1971,2.483786
1972,1.024579
1973,0.673837
1974,0.023417
1975,1.299405
1976,0.579061
1977,0.324834
1978,1.8058
1979,3.99177
1980,2.995571
1981,2.963973
1982,1.053762
1983,0.092379
1984,0.698488
1985,3.310332
1986,-0.020807
1987,2.156466
1988,-0.715549
1989,-0.864754
1990,-2.551167
1991,-1.159581
1992,-1.495605
1993,-1.094319
1994,-0.593278
1995,0.425906
1996,2.314079
1997,-0.165763
1998,0.93904
1999,-0.499783
2000,-0.65294
2001,-0.103198
2002,-1.094051
2003,1.383833
2004,-1.097577
2005,0.123177
2006,0.382909
2007,-1.300984
2008,-1.598916
2009,-0.55294
2010,-0.28313
2011,1.105542
2012,-0.668202
2013,1.96103
2014,-1.688419
2015,-0.897457
2016,-2.633099
2017,0.445701
2018,1.7699
2019,-0.902645
Area of snow-covered ground in the Northern Hemisphere each April-June compared to the 1981-2010 average. Snow-covered area has been below average throughout most of the past two decades. Data from Rutgers Snow Lab.
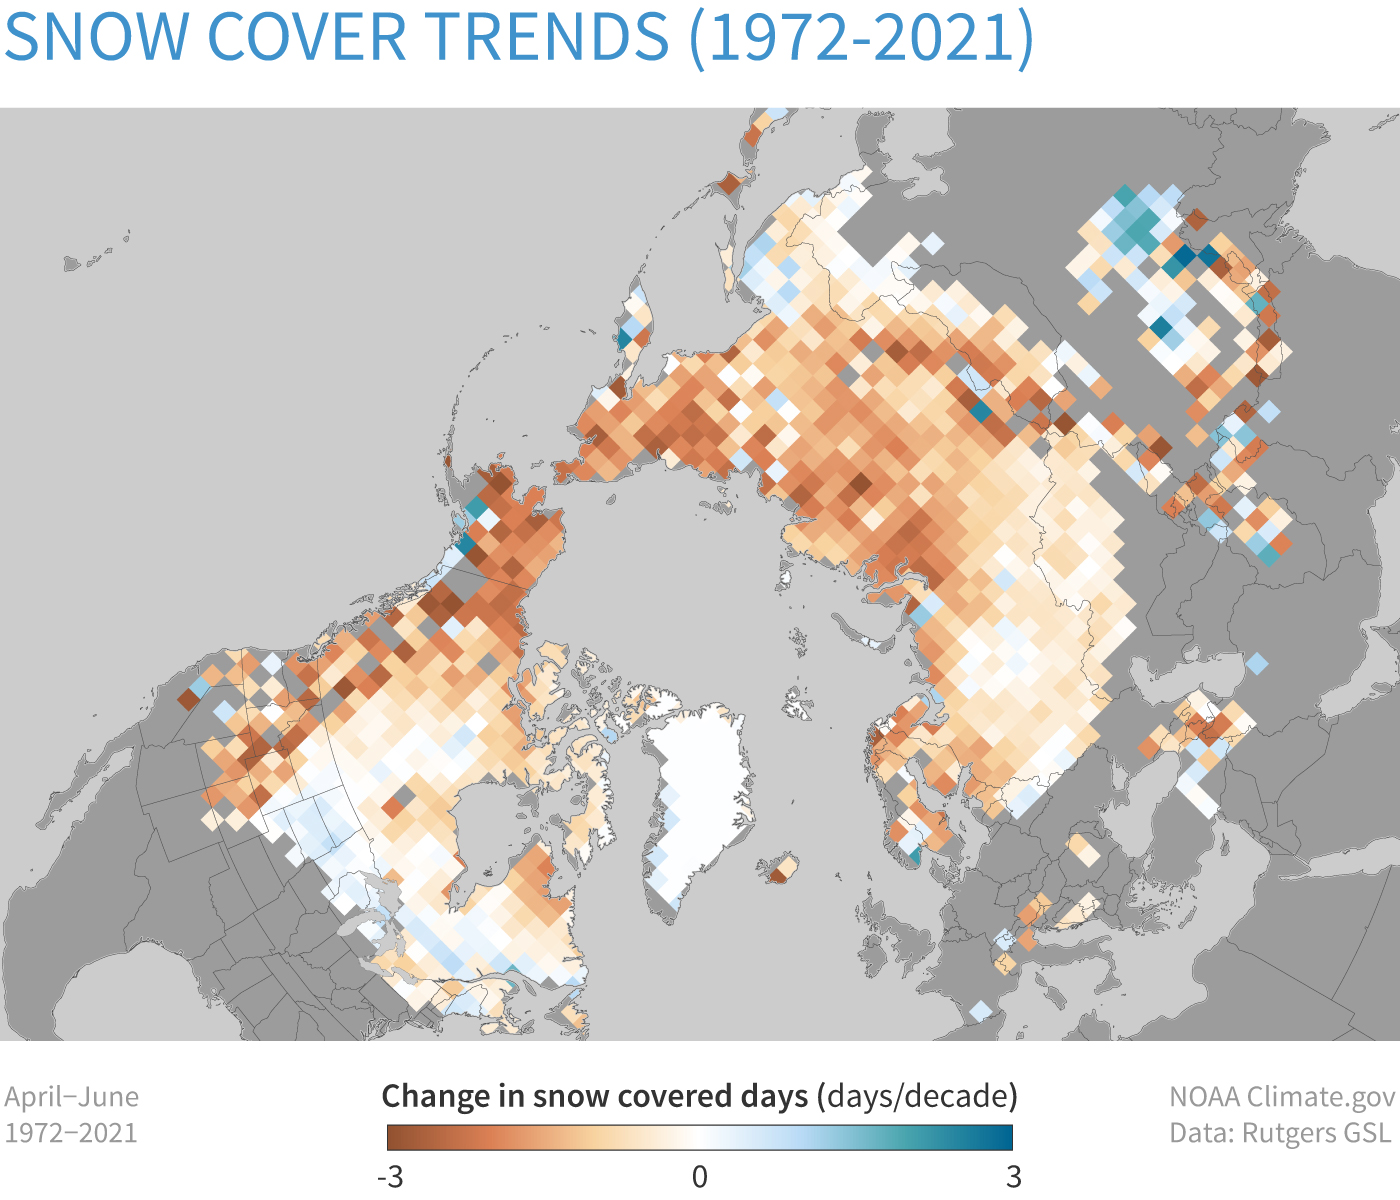
Change in the number of snow-covered days per decade in late spring (April–June) across the Northern Hemisphere. At most locations, late spring snow days are declining (brown). Data from Rutgers Snow Lab.
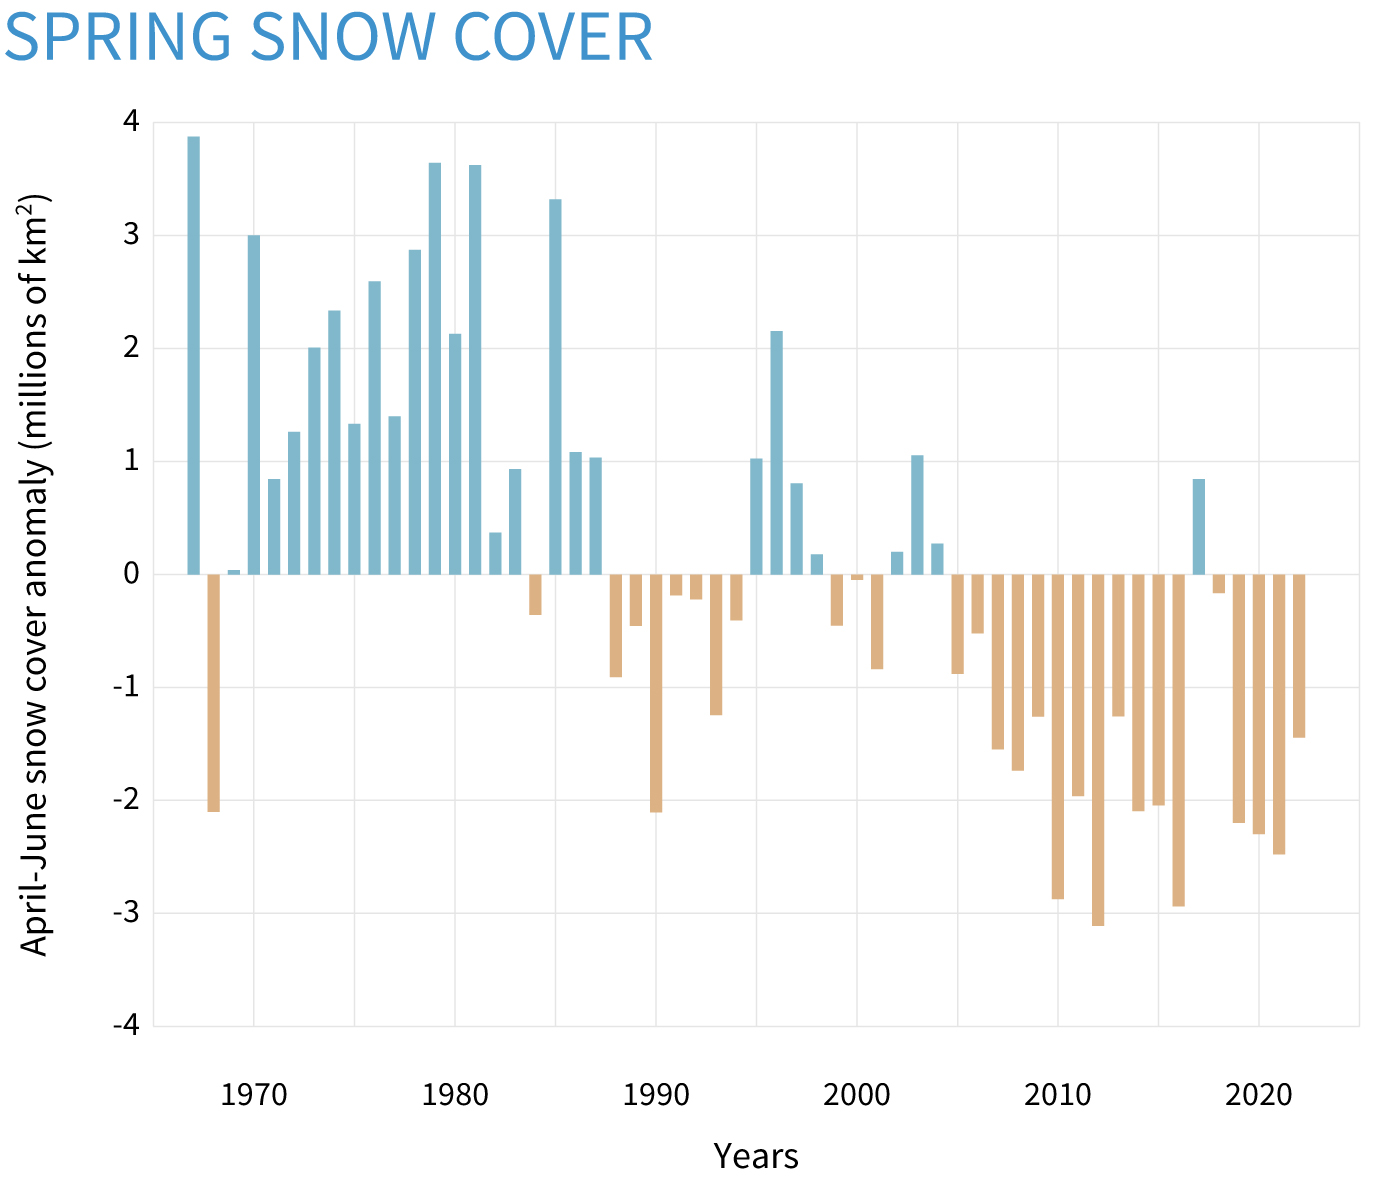
Spring (April–June) snow extent each year compared to the 1981–2010 average. Years with above-average snow cover are blue-green, while years with below-average snow cover are brown. Graph by NOAA Climate.gov, based on Rutgers Snow Lab data provided by Thomas Estilow.
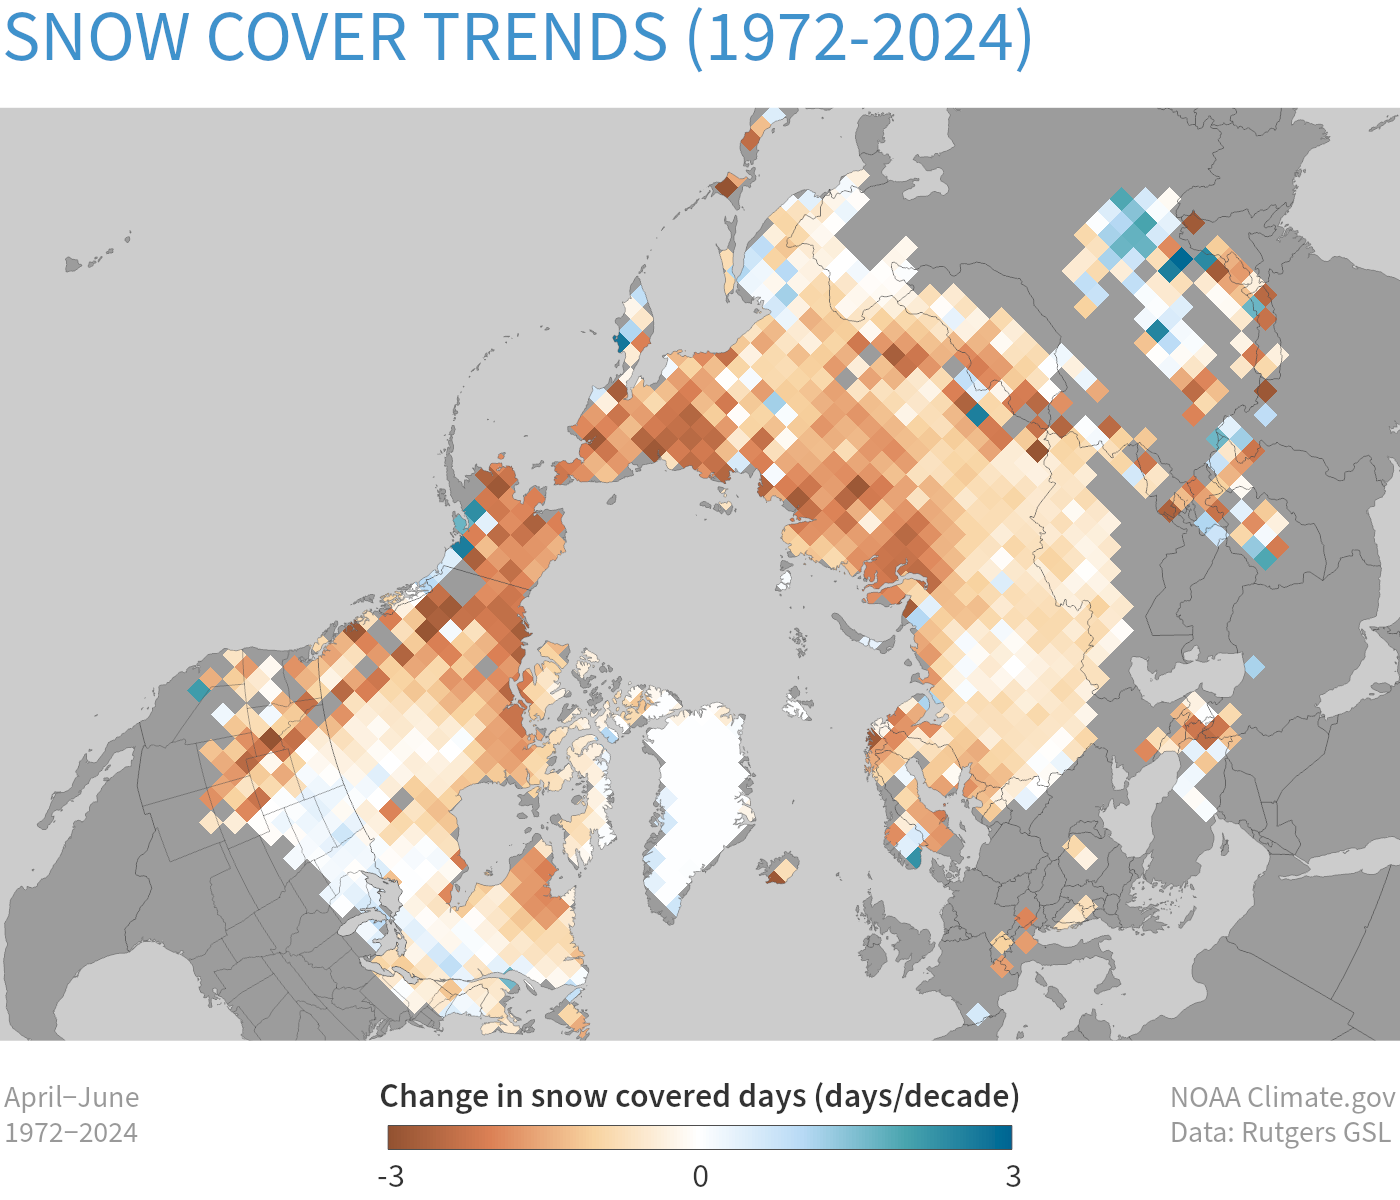
Map of April–June snow cover trends across the Northern Hemisphere from 1972–2024 based on satellite observations of the number of days each location had snow on the ground each year. Places where snow-covered days declined by up to three days per decade are shown in brown; places where snow-covered days increased by up to 3 days per decade are blue-green. (Only places that had snow in at least 25% of the years on record are included in the analysis). Most of the Northern Hemisphere has experienced declines in the number of snow-covered spring days over the past 5 decades. NOAA Climate.gov map, based on data and analysis by Rutgers Snow Lab.