1980,0.807
1981,0.825
1982,0.84
1983,0.859
1984,0.877
1985,0.896
1986,0.916
1987,0.935
1988,0.963
1989,0.984
1990,1
1991,1.016
1992,1.028
1993,1.035
1994,1.048
1995,1.064
1996,1.079
1997,1.09
1998,1.111
1999,1.129
2000,1.14
2001,1.151
2002,1.167
2003,1.186
2004,1.199
2005,1.213
2006,1.229
2007,1.243
2008,1.26
2009,1.273
2010,1.29
2011,1.305
2012,1.32
2013,1.34
2014,1.356
2015,1.374
2016,1.399
2017,1.415
2018,1.43
The red line shows the combined heating influence of all long-lived greenhouse gases in Earth's atmosphere: carbon dioxide, methane, nitrous oxide, and CFCs and similar gases. In 2023, the index was 1.51—a 51 percent increase since 1990.
The colored shapes in this graph show how much each greenhouse gas contributes to the total energy imbalance in Earth’s atmosphere. Together, these gases trapped nearly 3.5 extra Watts of heat energy per square meter in 2023 compared to 1750.
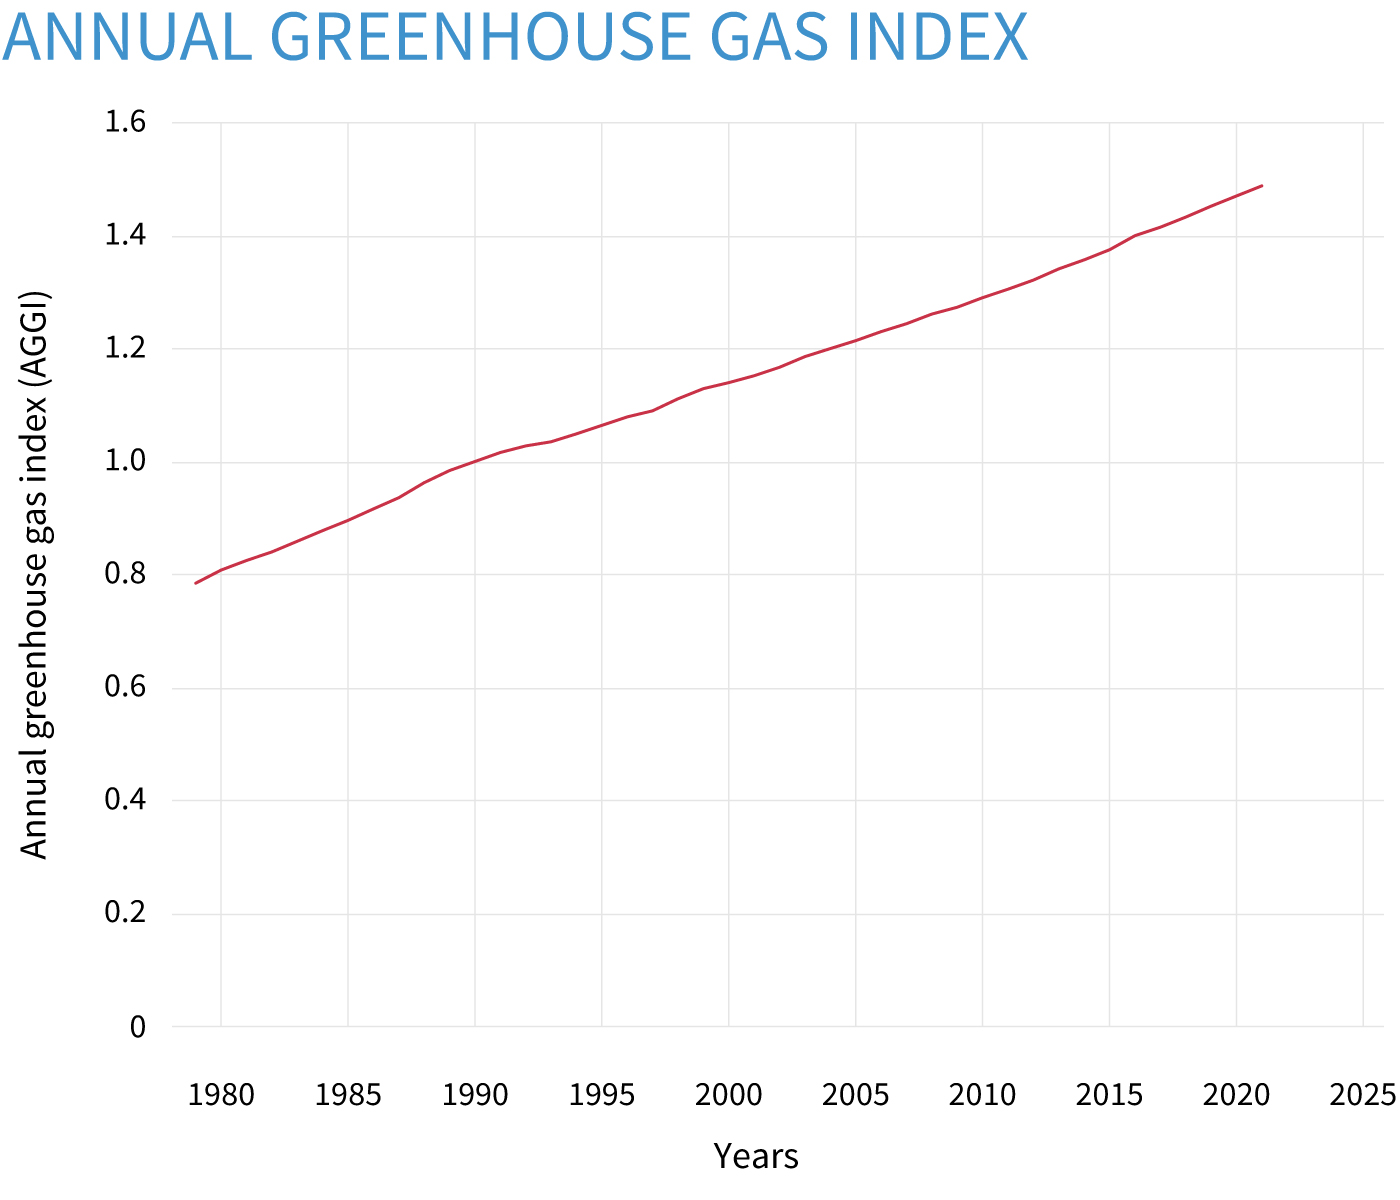
The AGGI—short for Annual Greenhouse Gas Index—reports the combined warming influence of all long-lived greenhouse gases as a fraction of their influence in 1990. NOAA Climate.gov graph, based on data from NOAA Global Monitoring Lab.
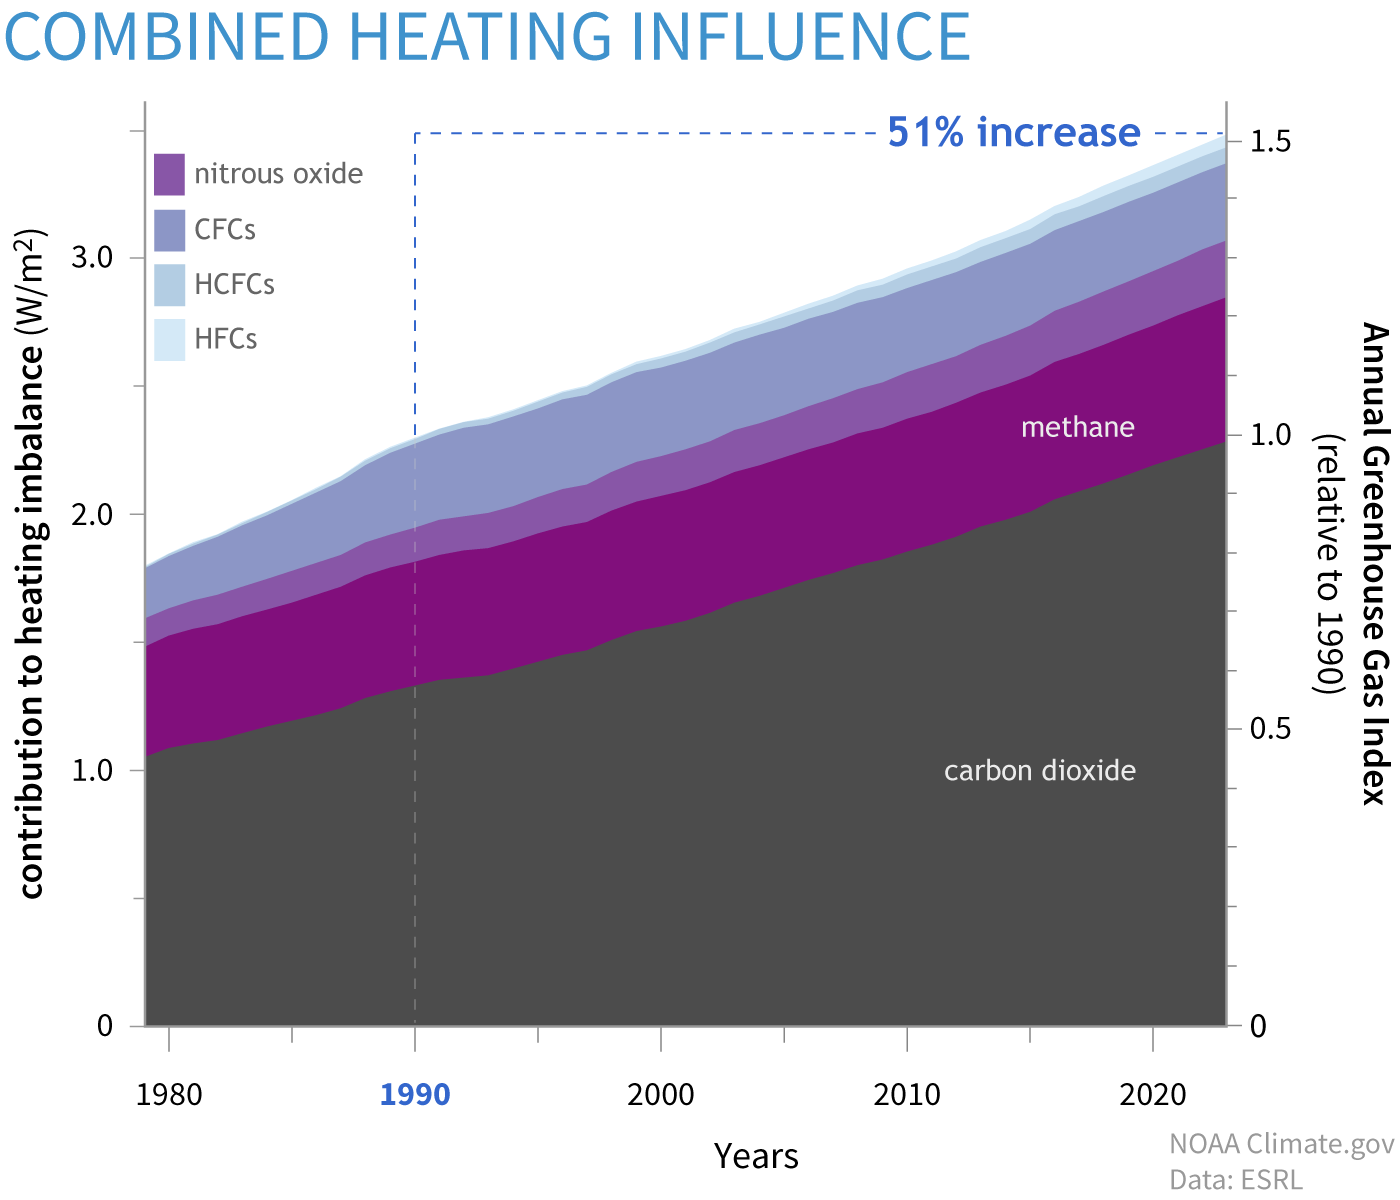
This graph shows the heating influence caused by the major human-produced greenhouse gases: carbon dioxide (gray), methane (dark purple), nitrous oxide (medium purple), chlorofluorocarbons (CFCs, lavender), hydrochlorofluorocarbons (HCFCs, blue), and hydrofluorocarbons (HFCs, light blue). Relative to conditions in 1750, today's atmosphere absorbs more than 3 extra watts of energy per square meter of Earth's surface. For the complete list of chemicals in the CFC, HFC, and HCFC groups, see Figure 3 in the Full AGGI Report. Graph by NOAA Climate.gov based on data from NOAA Global Monitoring Lab.