1981,-0.267
1982,-0.718
1983,-0.744
1984,-0.789
1985,-1.138
1986,-1.680
1987,-1.728
1988,-2.190
1989,-2.281
1990,-2.626
1991,-3.164
1992,-3.480
1993,-3.713
1994,-4.317
1995,-4.544
1996,-4.954
1997,-5.504
1998,-6.354
1999,-6.709
2000,-6.763
2001,-7.097
2002,-7.748
2003,-8.994
2004,-9.706
2005,-10.451
2006,-11.605
2007,-12.285
2008,-12.789
2009,-13.466
2010,-14.163
2011,-15.251
2012,-15.915
2013,-16.773
2014,-17.571
2015,-18.740
2016,-19.584
2017,-20.550

Through 2024, mountain glaciers in have lost more than 27 meters of water equivalent since 1970. That's roughly the same as slicing a 98-foot slab off the top each glacier. WGMS data.
Retreat of Alaska’s Muir Glacier between August 1941 and August 2004. In the six decades between the photos, the glacier has retreated far into the mountains. Photos from the National Snow and Ice Data Center.
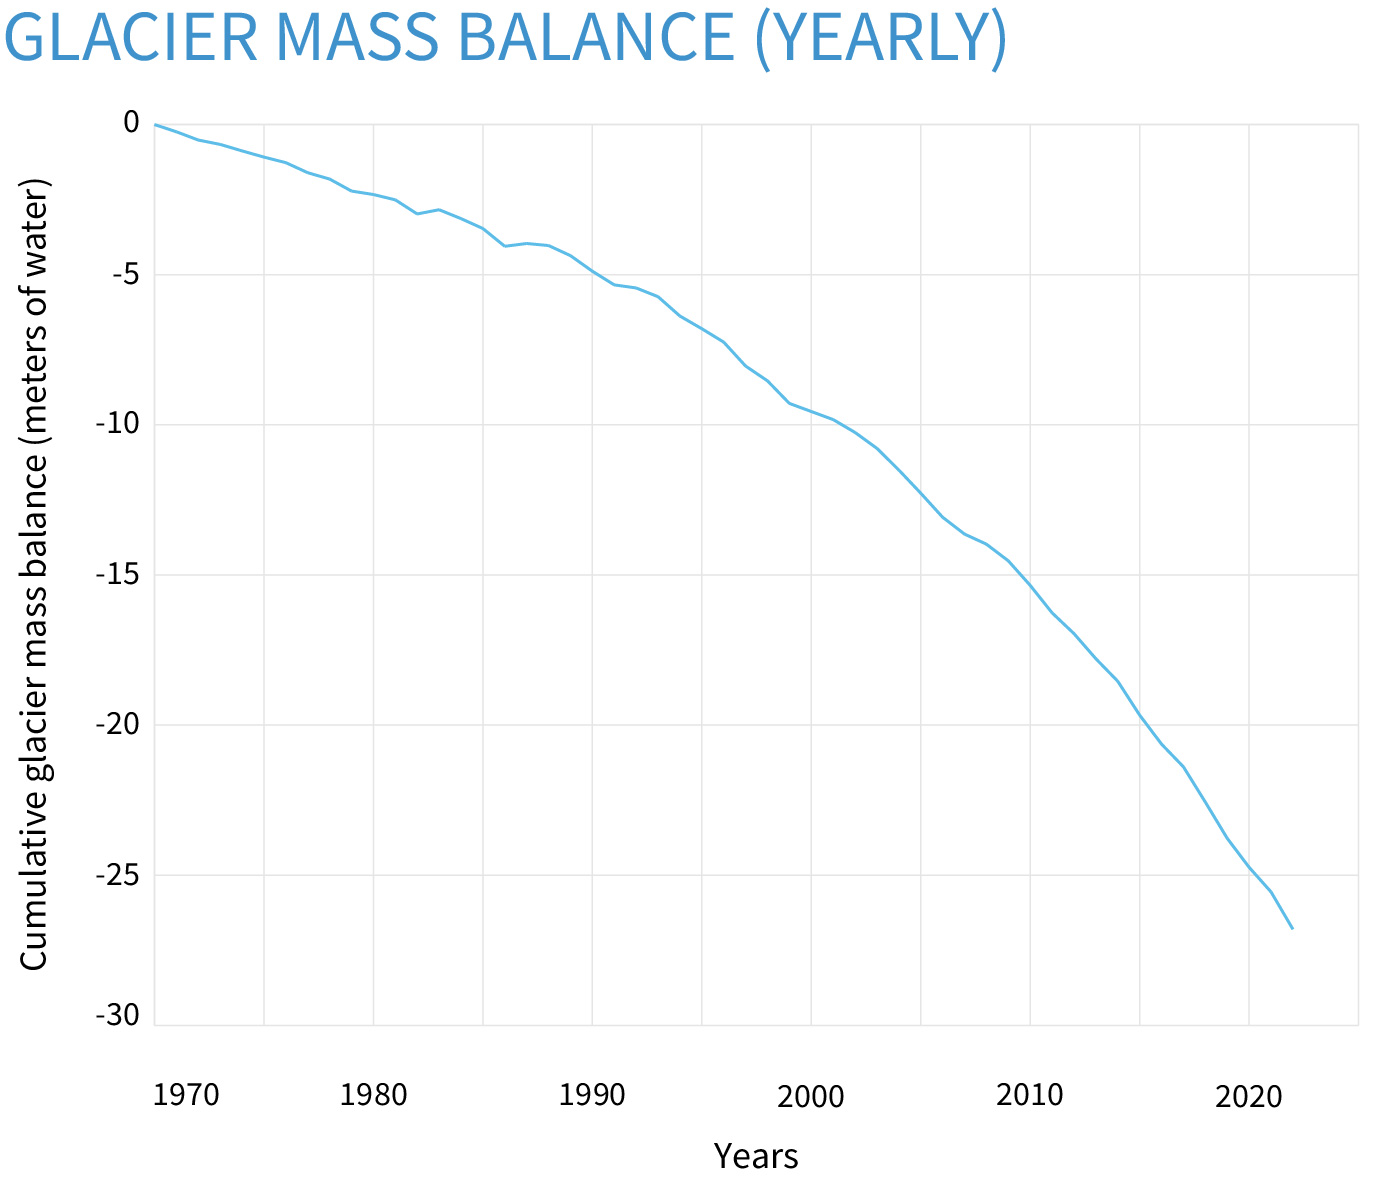
Cumulative ice loss from mountain glaciers in the World Glacier Monitoring Service (WGMS) "reference network," a collection of 30-40 glaciers from different parts of the world that have at least 30 years of observations. On average, these glaciers have lost ice equivalent to nearly 25 meters (82 feet) of water pooled across their surface areas. NOAA Climate.gov graph, based on data from WGMS.
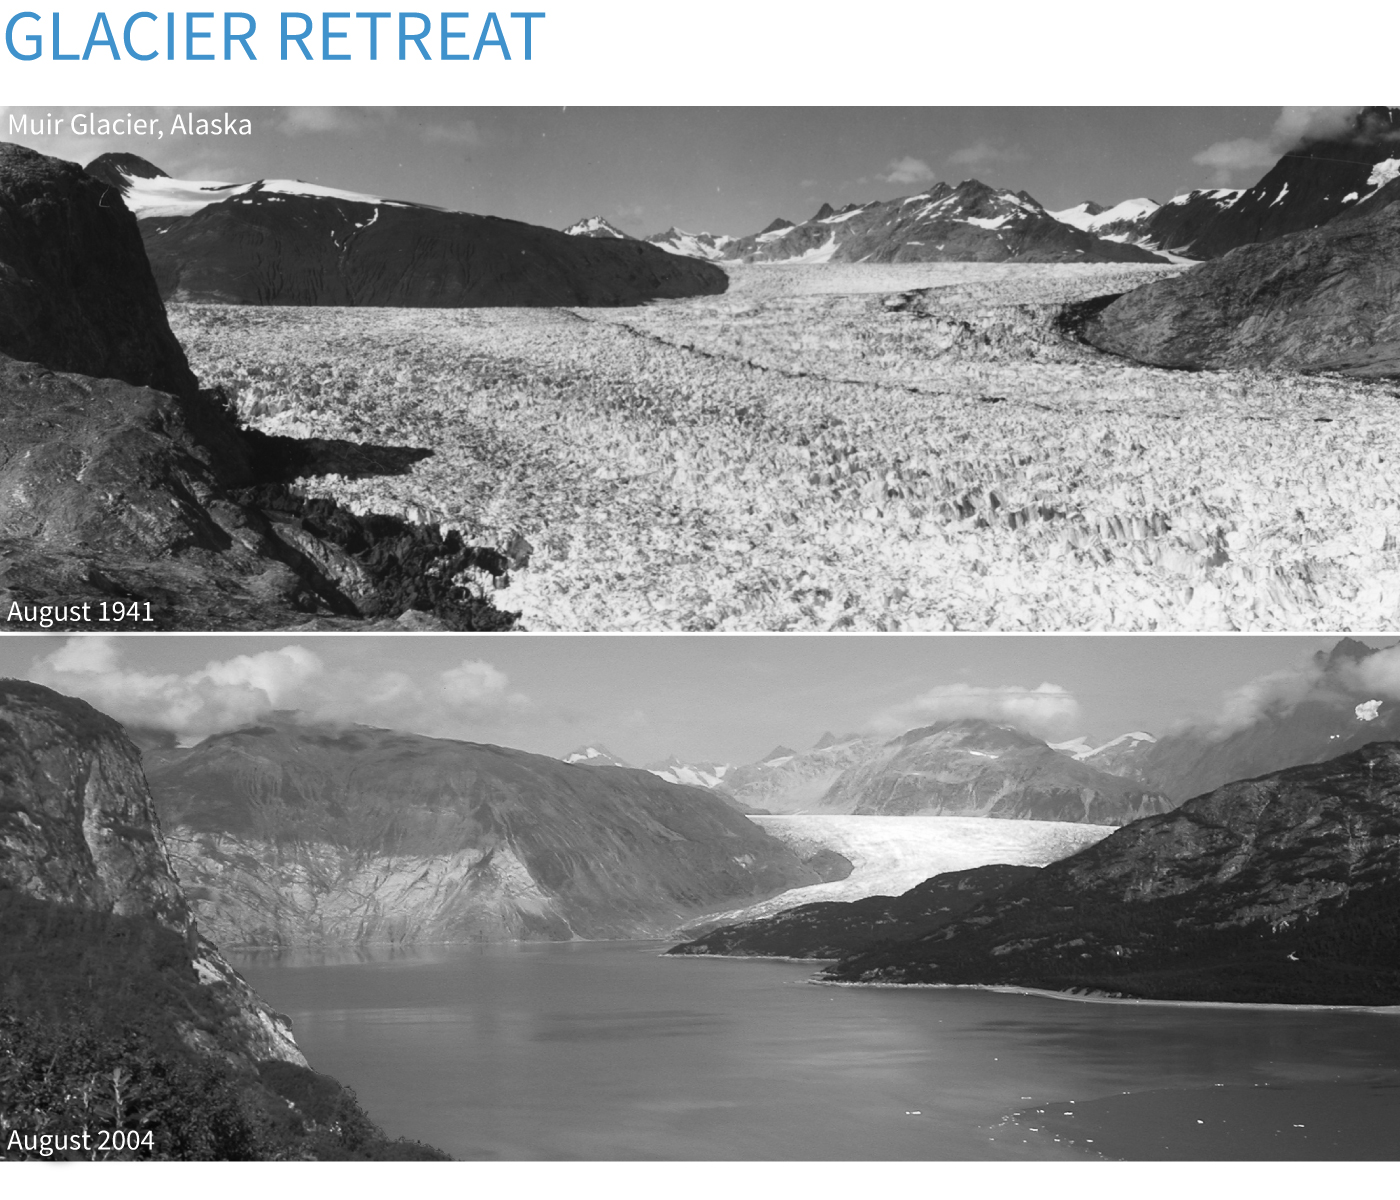
Retreat of southeastern Alaska’s Muir Glacier between August 1941 and August 2004. Historically, Muir Glacier was an iceberg-calving, tidewater glacier. Its terminus was grounded in the waters of Muir Inlet, a narrow opening to Glacier Bay. In the six decades between the two photos, it has retreated so far that it's terminus is now inland. Photos from the National Snow and Ice Data Center’s collection of repeat photography of glaciers.