198009,7.67
198109,7.14
198209,7.3
198309,7.39
198409,6.81
198509,6.7
198609,7.41
198709,7.28
198809,7.37
198909,7.01
199009,6.14
199109,6.47
199209,7.47
199309,6.4
199409,7.14
199509,6.08
199609,7.58
199709,6.69
199809,6.54
199909,6.12
200009,6.25
200109,6.73
200209,5.83
200309,6.12
200409,5.98
200509,5.5
200609,5.86
200709,4.27
200809,4.69
200909,5.26
201009,4.87
201109,4.56
201209,3.57
201309,5.21
201409,5.22
201509,4.62
201609,4.53
201709,4.82
201809,4.79
201909,4.32
The total area of the Arctic Ocean that was at least 15% ice covered each September (summer minimum) from 1979–2024. The last 18 September extents (2007-2024) are the 18 lowest on record. Data from the National Snow and Ice Data Center (NSIDC).
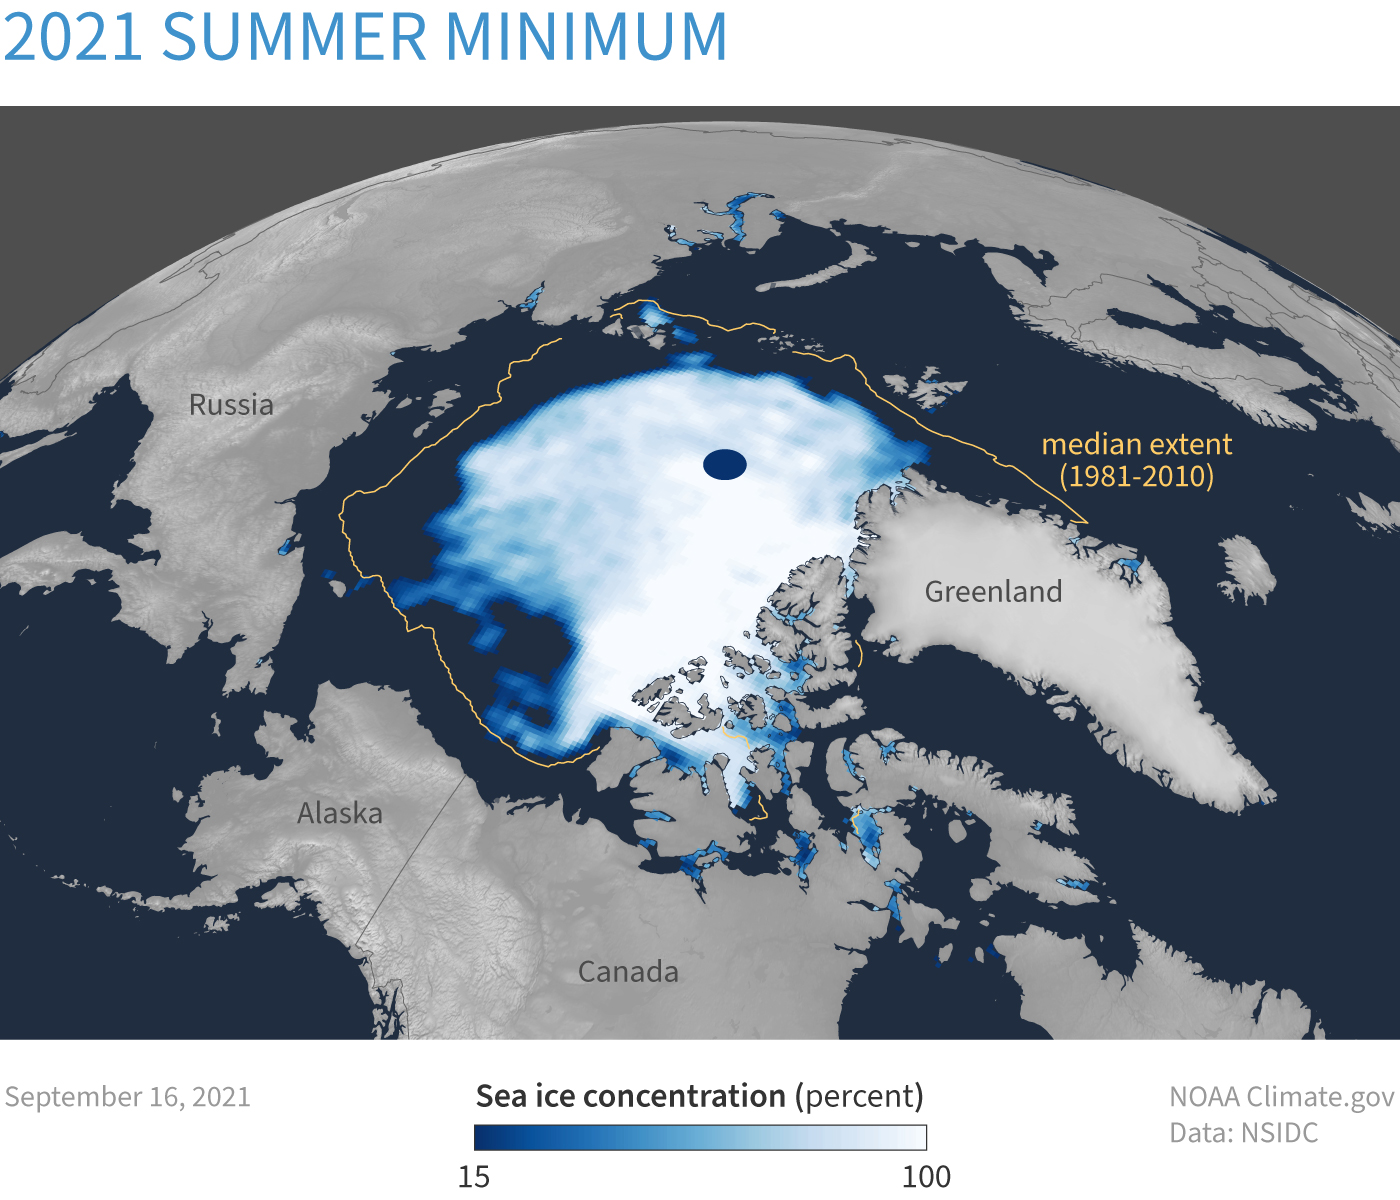
Sea ice concentration for September 2024, compared to the 1981-2010 average extent for that month (gold line). It was the sixth smallest summer minimum on record. NOAA Climate.gov image, based on data from the National Snow and Ice Data Center (NSIDC).
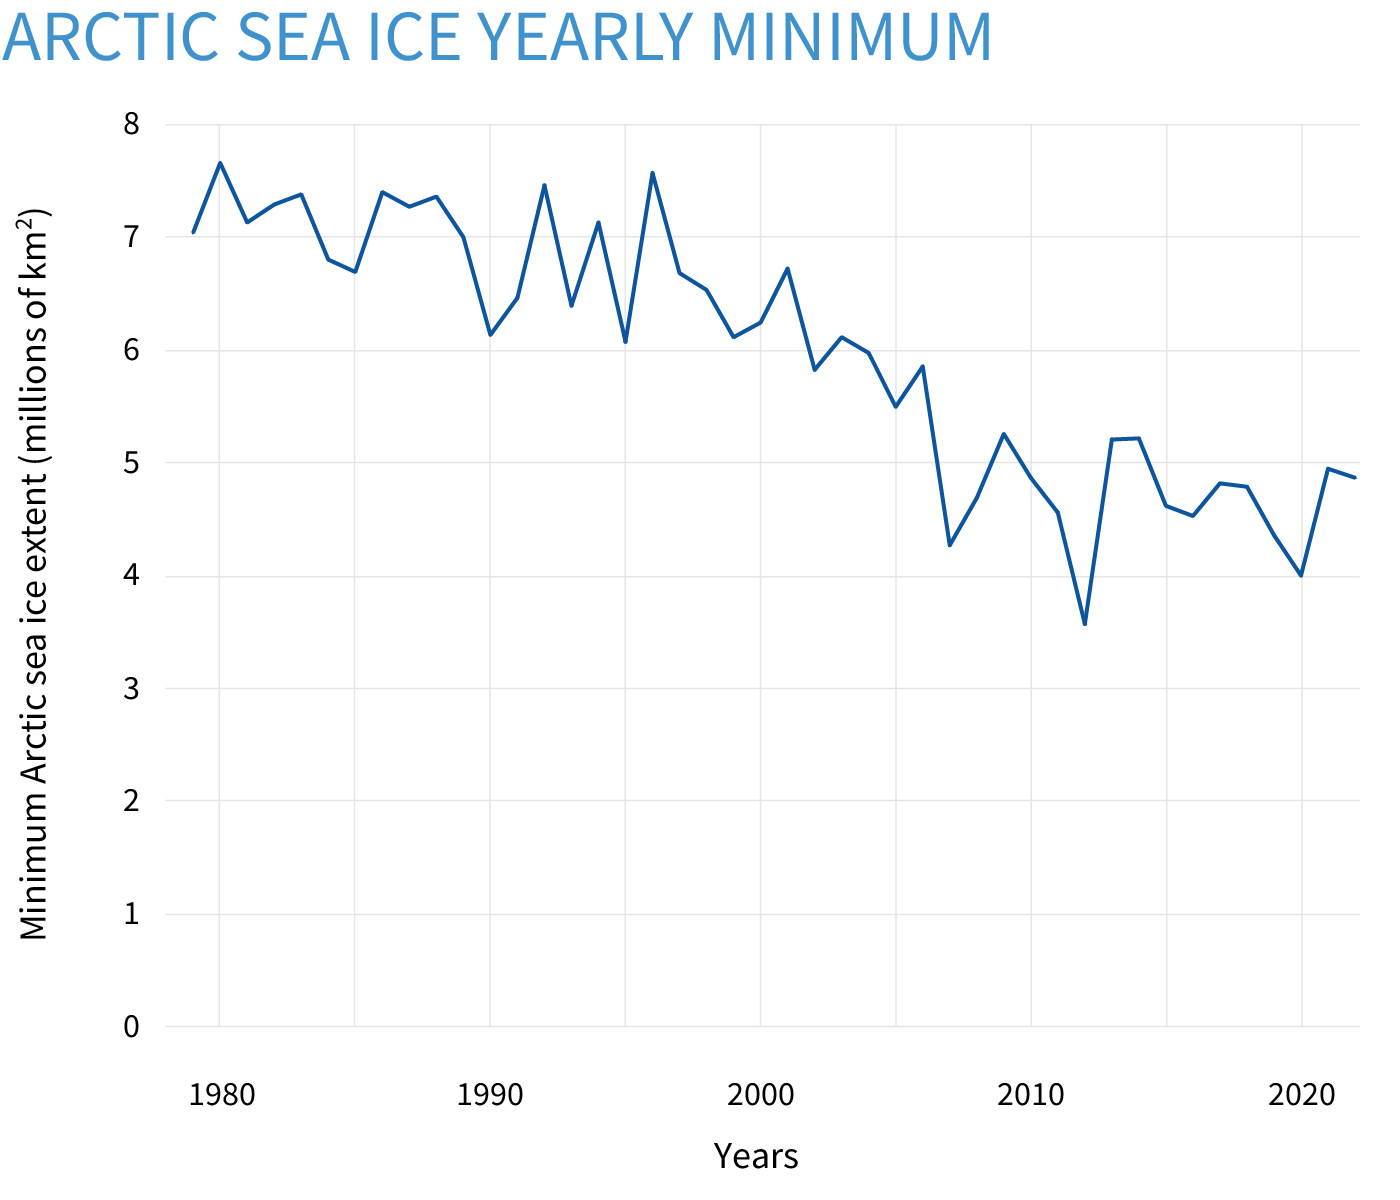
Sea ice extent in the Arctic at the end of the summer melt season each September from 1979–2022, based on satellite observations. The total extent is the area of all pixels in the satellite image where the ice concentration is at least 15 percent. The amount of sea ice ice that survives the summer melt is declining rapidly. NOAA Climate.gov graph, based on extent data from the National Snow and Ice Data Center.
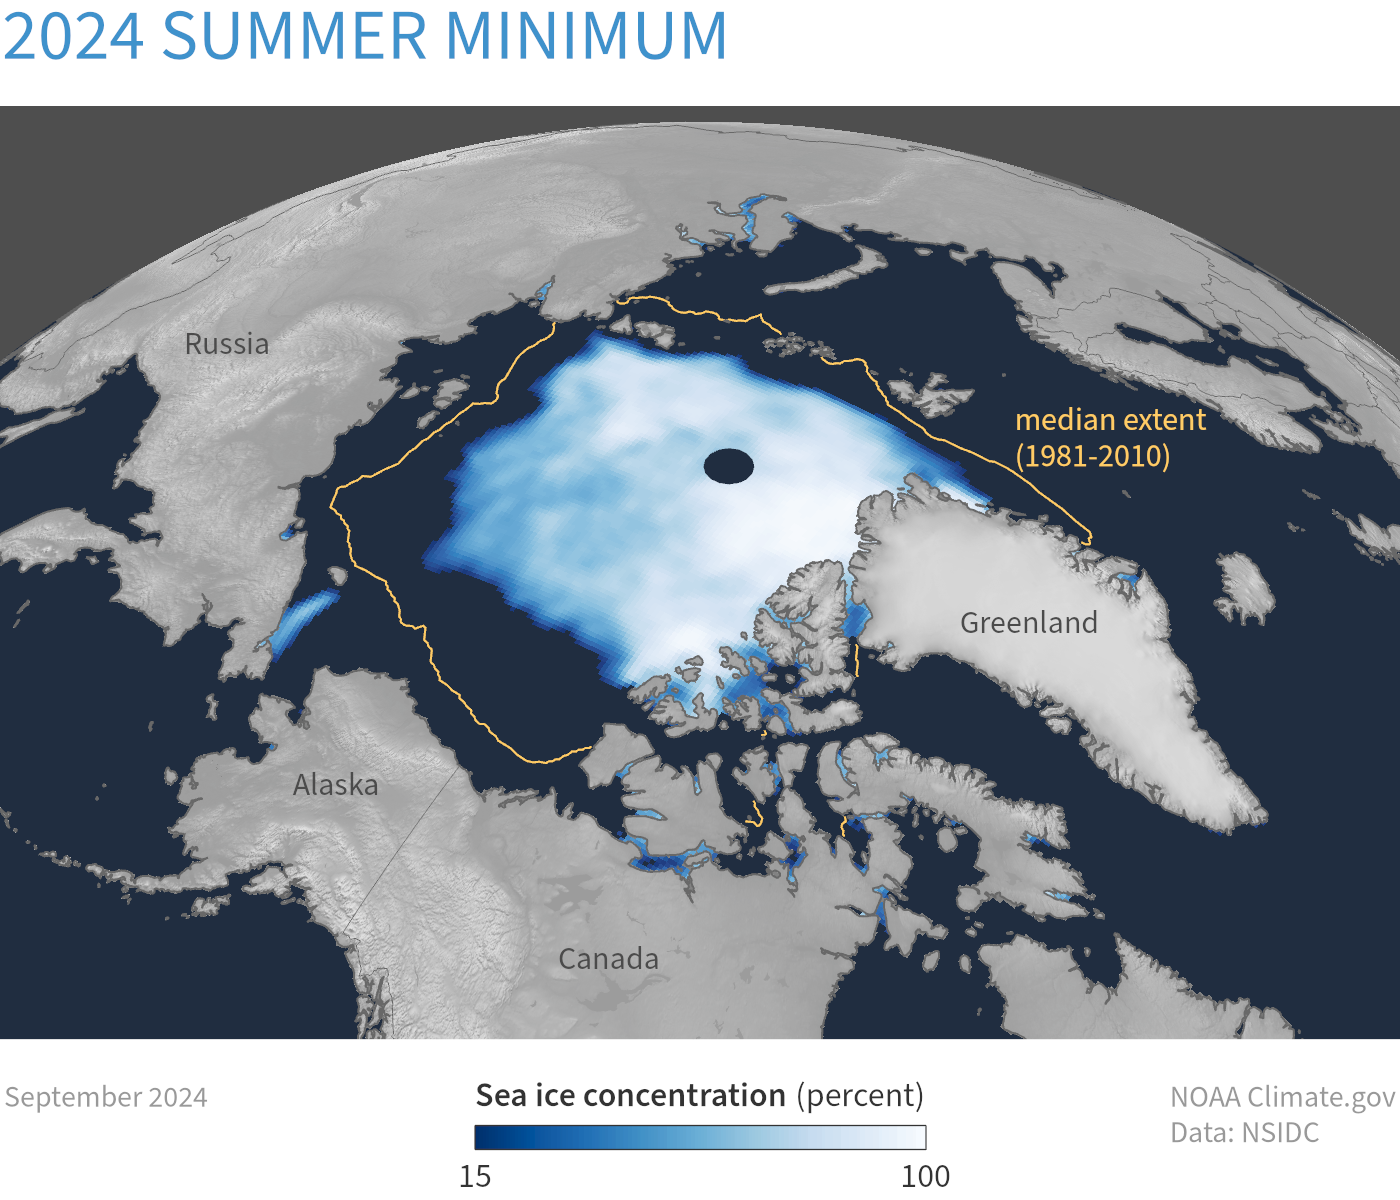
Average Arctic sea ice concentration for September 2024, the month with the smallest ice extent of the year, based on satellite images. Extent is the total area of ocean that's at least 15 percent ice covered. The gold line is the median extent for 1981-2010: half of years had smaller extents, half had larger. NOAA Climate.gov image, based on data from the National Snow and Ice Data Center.