Maps & Data
Data Snapshots (Images)
Browse a range of easy-to-understand climate maps in a single interface.
Climate Data Mapper (Interactive)
Visualize climate data via an interactive web map.
Climate Data Primer
Find out about measuring, modeling, and predicting climate and ways to find and use climate data.
Learn moreDataset Gallery
& Advanced Tools
Browse stories about the ‘climate behind the weather’ in this interactive map of current events found in our News and Features department.
View this tool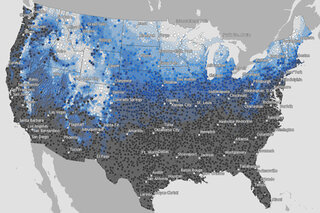
Map of the historic probability of there being at least 1 inch of snow on the ground in the Lower 48 states on December 25 based on the latest U.S. Climate Normals from NOAA NCEI.
View this tool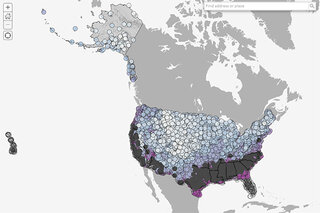
When does the climate record say you can expect the season's first snow? This map shows the historic date by which there's a 50% chance of at least 0.1" of snow on the ground, based on snowfall data from 1981-2010.
View this tool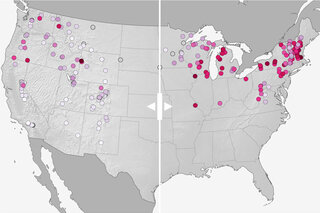
Compare projected changes in downhill ski season length by 2050 if we follow a moderate versus a high pathway of carbon emissions.
View this tool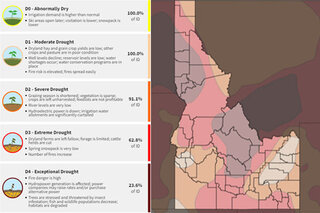
Interactive table and map showing state- and county-specific drought impacts ranked by U.S. Drought Monitor categories, including impacts to industry, natural resources, and human health.
View this tool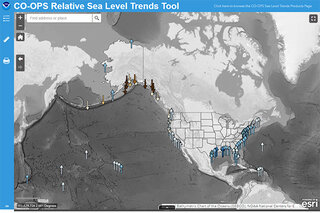
Long-term sea level change trends at 100+ U.S. locations. Blue, upward arrows show where local sea level is rising. Brown, downward arrows show where local sea level is falling.
View this tool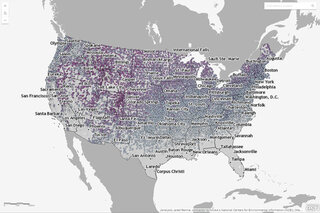
This interactive map shows the latest day for which snow greater than 0.1 inches was recorded for thousands of U.S. weather stations during their period of operation (up through April 11 of 2018).
View this tool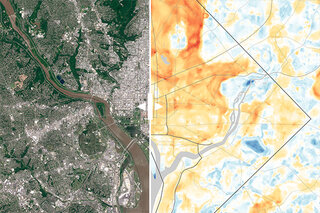
Heat maps and matching satellite images presented with a slider, so that readers can get a sense of how and why each city experiences such a wide range of temperatures on a hot summer day.
View this tool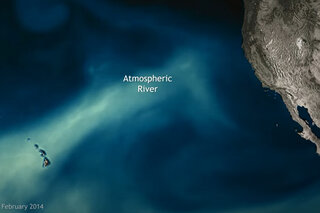
This video of data from February 2014 shows storm clouds, then an animation of moisture from the tropics, and finally, how the atmospheric river banked up against the storm's cold front and moved inland with it.
View this tool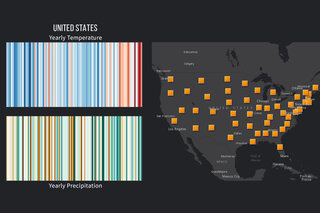
This Storymap provides access to a collection of "stripes" graphics, in which a location's yearly temperature and precipitation conditions since 1895 are shown as a simple row of colored stripes without dates or numbers.
View this tool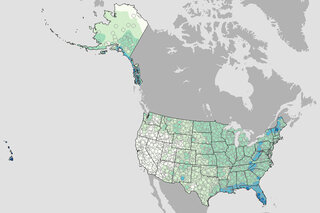
What are the chances of rain on the Fourth of July? This map shows the historic probability of there being of at least 0.1 inch of rain on the July 4 based on the latest U.S. Climate Normals from NOAA NCEI.
View this tool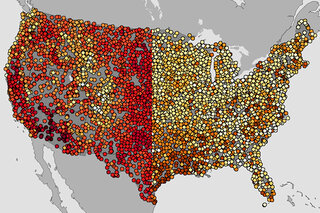
Interactive map of the hottest maximum temperatures at locations and when that record was set, recorded at thousands of U.S. stations.
View this toolGlobal Climate Dashboard
Tracking climate change and natural variability over time
Dataset Gallery & Advanced Tools
Future Climate Projections - Graphs & Maps
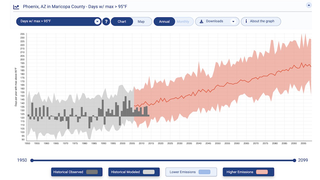
U.S. Climate Resilience Toolkit – Climate Explorer
Check future climate projections for any county in the contiguous United States or borough in Alaska. Generate graphs or maps to compare projections against conditions observed in the recent past.
Explore this Dataset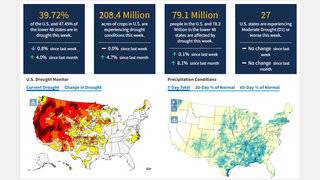
Drought.gov - Maps, Graphs, and More
National Integrated Drought Information System
A one-stop shop for current, reliable, and useful information and resources related to drought conditions and associated risks.
Explore this Dataset
NOAA Voices - Oral History Archives
NOAA Voices
A digital archive of oral history interviews related to our changing environment, climate, oceans, and coasts. The entire database houses nearly 2300 unique oral histories as part of 118 distinct collections.
Explore this Dataset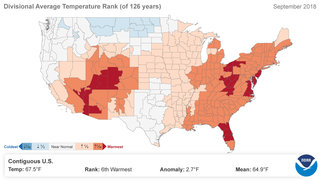
Monthly Climate Conditions - Interactive Map
Climate at a Glance: U.S. Mapping
Generate maps showing data for each of the 344 climate divisions in the U.S. Climate Divisional Database.
Explore this Dataset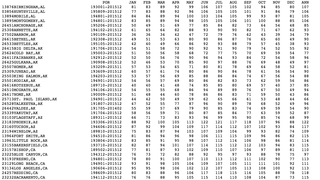
Climate Statistics at Individual Stations — Data Tables
Comparative Climatic Data
This site provides data tables for comparing record-setting conditions and Climate Normals at major U.S. weather observing stations in the United States.
Explore this Dataset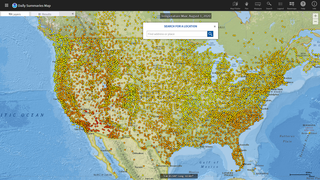
NCEI Map Viewer Application - Data Locator
GIS Maps | National Centers for Environmental Information (NCEI)
NCEI's Map Viewer Application presents a map interface to help users find, preview, and download or order climate and weather data.
Explore this Dataset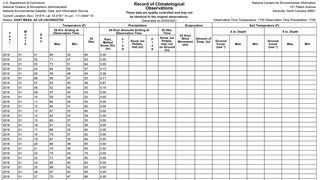
Past Weather by Zip Code - Data Table
Climate Data Online - Daily Summaries
How much rain fell over the weekend? What was the temperature over the last few weeks? Tables of daily weather observations can answer these common questions.
Explore this Dataset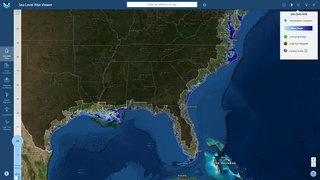
Sea Level Rise - Map Viewer
Sea Level Rise and Coastal Flooding Impacts
NOAA's Sea Level Rise map viewer gives users a way to visualize community-level impacts from coastal flooding or sea level rise (up to 10 feet above average high tides).
Explore this Dataset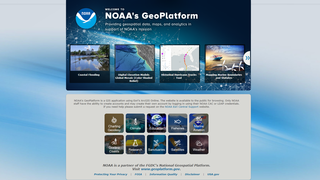
NOAA's GeoPlatform - Geospatial Data, Maps, & Apps
NOAA's GeoPlatform
NOAA's Geoplatform provides geospatial data, maps, and analytics in support of NOAA's mission through a GIS application using Esri's ArcGIS Online. Maps, Layers, Scenes, Apps and StoryMaps are available to the public for browsing.
Explore this Dataset