Global warming frequently asked questions
 Editor's note: Our Climate Q&A department offers many of these questions in a longer, illustrated format.
| Basics | |
| + -
Is the globe warming? Yes, our world is warming at an unusually rapid rate, and this is now the warmest period in the history of modern civilization. [1] Earth’s average surface temperature has risen by 1.8°F (1.0°C) since the late 1800s, an average rate of 0.13° F (0.07° C) per decade. Since 1981, the rate of warming has more than doubled to 0.32°F (0.18°C) per decade. The six warmest years in the 1880–2020 record have all occurred since 2014, while 19 of the 20 warmest years have occurred since 2001. [2] With significant reductions in the emissions of greenhouse gases, the annual global surface temperature rise this century could be limited to 3.6°F (2°C) or less. Without major reductions in these emissions, the increase in annual average global temperatures relative to preindustrial times could reach 9°F (5°C) or more by the end of this century. [45] Learn more here and here. |
|
| + -
Did global warming stop in 1998? No, our world continued warming after 1998. [13] Thanks to natural climate variability, volcanic eruptions, and to a smaller extent, low solar activity, the rate of average global surface warming from 1998–2013 was slower than it had been over the two preceding decades. Such varations in the rate of warming from decade to decade are common. [14] Meanwhile, excess heat continued to accumulate in the deeper layers of the ocean, contributing to marine heat waves and sea level rise. [13] The slowdown in surface warming was only temporary, however, as the six warmest years in recorded history have all occurred after 2013. [15] Learn more here, here, and here. |
|
| + -
Can we trust NOAA’s global temperature data record? Yes, we can trust the Global Historical Climatology Network (GHCN) data for three key reasons:
|
|
| + -
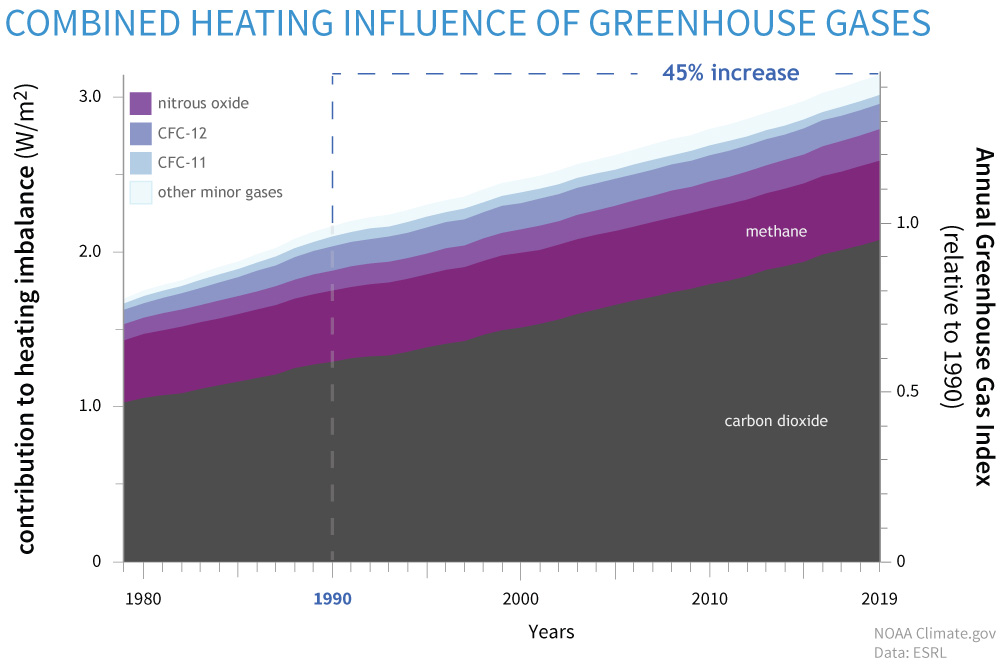
Are humans causing or contributing to global warming? Yes, by increasing the abundance of greenhouse gases in the atmosphere, human activities are amplifying Earth’s natural greenhouse effect. Virtually all climate scientists agree that this increase in heat-trapping gases is the main reason for the 1.8°F (1.0°C) rise in global average temperature since the late nineteenth century. [1] Carbon dioxide, methane, nitrous oxide, ozone, and various chlorofluorocarbons are all human-emitted heat-trapping gases. Among these, carbon dioxide is of greatest concern to scientists because it exerts a larger overall warming influence than the other gases combined. At present, humans are putting an estimated 9.5 billion metric tons of carbon into the atmosphere each year by burning fossil fuels, and another 1.5 billion through deforestation and other land cover changes. Of this human-produced carbon, forests and other vegetation absorb around 3.2 billion metric tons per year, while the ocean absorbs about 2.5 billion metric tons per year. A net 5 billion metric tons of human-produced carbon remain in the atmosphere each year, raising the global average carbon dioxide concentrations by about 2.3 parts per million per year. Since 1750, humans have increased the abundance of carbon dioxide in the atmosphere by nearly 50 percent. [29] Learn more. |
|
| + -
What is the difference between global warming and climate change? Both phrases can have slightly different meanings in different contexts, but these days, global warming generally refers to the long-term increase in global average temperature as a result of human activity. Climate change is a much broader term that covers changes in multiple parts of the climate system, from temperature to precipitation to wind patterns. Climate change can be local, regional, or global, and it can have natural or human causes. Global warming is a type of climate change; however, not all climate change is global warming. Learn more. |
|
| + -
What scientific evidence exists that Earth is warming and that humans are the main cause? We know the world is warming because people have been recording daily high and low temperatures at thousands of weather stations worldwide, over land and ocean, for many decades and, in some locations, for more than a century. [3] When different teams of climate scientists in different agencies (e.g., NOAA and NASA) and in other countries (e.g., the U.K.’s Hadley Centre) average these data together, they all find essentially the same result: Earth’s average surface temperature has risen by about 1.8°F (1.0°C) since 1880. [1] In addition to our surface station data, we have many different lines of evidence that Earth is warming (learn more). Birds are migrating earlier, and their migration patterns are changing. Lobsters and other marine species are moving north. Plants are blooming earlier in the spring. Mountain glaciers are melting and snow cover is declining in the Northern Hemisphere (Learn more here and here). Greenland’s ice sheet—which holds about 8 percent of Earth’s fresh water—is melting at an accelerating rate (learn more). Mean global sea level is rising (learn more). Arctic sea ice is declining rapidly in both thickness and extent (learn more). We know this warming is largely caused by human activities because the key role that carbon dioxide plays in maintaining Earth’s natural greenhouse effect has been understood since the mid-1800s. Unless it is offset by some equally large cooling influence, more atmospheric carbon dioxide will lead to warmer surface temperatures. Since 1800, the amount of carbon dioxide in the atmosphere has increased from about 280 parts per million to 410 ppm in 2019. We know from both its rapid increase and its isotopic “fingerprint” that the source of this new carbon dioxide is fossil fuels, and not natural sources like forest fires, volcanoes, or outgassing from the ocean. Finally, no other known climate influences have changed enough to account for the observed warming trend. Taken together, these and other lines of evidence point squarely to human activities as the cause of recent global warming. |
|
| + -
How do we know the build-up of carbon dioxide in the atmosphere is caused by humans? The most basic reason is that fossil fuels—the equivalent of millions of years of plant growth—are the only source of carbon dioxide large enough to raise atmospheric carbon dioxide amounts as high and as quickly as they have risen. The increase between the year 1800 and today is 70 percent larger than the increase that occurred when Earth climbed out of the last ice age between 17,500 and 11,500 years ago, and it occurred 100–200 times faster. [32] In addition, fossil fuels are the only source of carbon consistent with the isotopic fingerprint of the carbon present in today’s atmosphere. That analysis indicates it must be coming from terrestrial plant matter, and it must be very, very old. These and other lines of evidence leave no doubt that fossil fuels are the primary source of the carbon dioxide building up in Earth’s atmosphere. Read more. |
|
| + -
Isn’t there a lot of debate and disagreement among climate scientists about global warming? No. By a large majority, climate scientists agree with the following statements:[9] [10] [11] [12]
This scientific consensus is clearly summarized in the climate assessment reports of the U.S. Global Change Research Program and the Intergovernmental Panel on Climate Change. [1] [4] [5] NOAA scientists played lead roles in authoring and editing both sets of reports. Additionally, the United States’ foremost science agencies and organizations have all recognized global warming as a human-caused problem that threatens human and natural systems and, therefore, should be addressed. These agencies and organizations include (but are not limited to) NASA; the National Academies of Sciences, Engineering, and Medicine; the American Meteorological Society; the American Geophysical Union; the American Association for the Advancement of Science; the American Physical Society; the American Chemical Society; the American Medical Association; the Geological Society of America; and the Union of Concerned Scientists. |
|
| + -
What is the difference between weather and climate? Weather is the short-term atmospheric conditions at a given location on a specific day and time. Climate is usually described as the long-term average weather at a given place, but it also means the range of weather conditions that are possible at a given place, including the types and historical frequency of extreme events that occur there. By analogy, if the outcome of any given at-bat is like the weather, then a baseball player’s career batting average is like the climate. There’s an old saying: “Climate is what you expect; weather is what you get.” Another way to think about the difference between weather and climate is to say that a region’s climate is the background conditions that give rise to a location’s weather events. Because all weather occurs within Earth’s climate system, changes in the background state of the climate system can make different weather outcomes more or less likely to happen. For example, during the period from 1997-2018, the percentage area of the globe that experienced record-setting warm temperatures dwarfed the percentage area of the globe that experienced record-setting cold temperatures. [16] This was a predictable set of weather outcomes due to global warming. Learn more. |
|
| + -
Why should I trust scientists’ climate projections for 50 or 100 years from now when they can’t accurately forecast the weather more than 2 weeks from now? In many ways, it is actually harder to forecast weather 2 weeks in advance than it is to forecast climate decades in advance because weather is about the exact conditions and climate is about average conditions. Climate models are not trying, for example, to forecast the exact daytime high temperature in Chicago, IL, on August 15, 2035. They are trying to forecast the average daytime high temperature for the month of August over the entire decade of the 2030s. And while the exact weather conditions at a given location can change dramatically from hour to hour, the average climate changes much less from year to year or even decade to decade. The difference in time scale means that our ability to predict future climate doesn’t depend on our ability to predict next week’s weather. More details: Not only are weather models predicting different things than climate models, they require different kinds of starting information. Modelers call weather forecasting an initial conditions problem because, at short time scales, the future atmospheric conditions depend mostly on the initial atmospheric conditions. The accuracy of your forecast for a given location depends heavily on how well you can describe these initial conditions, especially in the surrounding area. In contrast, most modelers describe a climate projection as a boundary conditions problem because at long time scales (years to decades), future climate depends mostly on big-picture characteristics of the Earth system that don’t vary from day to day: the amount of land and ocean surface, the height and location of mountain ranges, the geometry of Earth’s orbit, and—crucially—the composition of the global atmosphere. These things define the boundaries of the climate system, the relatively narrow range of outcomes that are possible over long time frames. These fundamental differences between weather models and climate models, in both what they are trying to predict and what those predictions depend on, mean that the quality of a weather forecast two weeks out isn’t a good test of how well we can predict the climate two decades out. |
|
| Causes | |
| + -
How do greenhouse gases such as carbon dioxide cause global warming? Different gases interact with light and heat energy in different ways. The chemical structure of greenhouse gases, including carbon dioxide, water vapor, and methane, allows them to absorb some of the heat energy radiated from Earth’s surface. They re-radiate some of it back toward the surface, like the bricks in a chimney radiate warmth back into a room even after a fire goes out. This behavior is the foundation of Earth’s natural greenhouse effect, which scientists have understood since the mid-1800s. The more greenhouse gases in the atmosphere, the more heat energy the atmosphere traps near the surface (learn more), causing Earth’s surface temperature to rise. The initial warming due to increasing carbon dioxide kicks off several feedback loops: more water vapor, which is a powerful greenhouse gas; permafrost thaw and decomposition, which releases more methane and carbon dioxide; loss of sea ice and snow, which reduces the amount of sunlight the Earth reflects; and outgassing of additional carbon dioxide from the ocean. Together, these feedback loops make the actual warming two or more times larger than it would be due to carbon dioxide increases alone. [28] |
|
| + -
Which greenhouse gas is more important to Earth’s temperature: water vapor or carbon dioxide? Without our heat-trapping atmosphere, Earth’s surface temperature would be near freezing, instead of close to 60° Fahrenheit. Water vapor is directly responsible for about 50 percent of Earth’s natural greenhouse effect, while carbon dioxide accounts for about 20 percent. [20] So in terms of total warming, water vapor is the most important greenhouse gas. But without the background warmth provided by carbon dioxide—which doesn’t condense and rain out of the atmosphere as water vapor does—the atmosphere would be too cold to support much water vapor, and the entire greenhouse effect would collapse. Models indicate Earth would likely freeze over everywhere but the equator. [21] So in terms of making the greenhouse effect possible, carbon dioxide is the most important greenhouse gas. As the most abundant of the non-condensing greenhouse gases, carbon dioxide is the main control knob—the thermostat—of Earth’s greenhouse effect. [20] Increases in atmospheric carbon dioxide from human activities are turning the thermostat up. As surface temperatures rise, more water evaporates, enhancing the initial warming. This water vapor feedback loop is powerful, at least doubling the warming provided by carbon dioxide alone. [18] [19] [20] But water vapor can’t act on its own to cause climate change; it can only amplify a change caused by the non-condensing greenhouse gases or other climate influences, such as variations in incoming sunlight. That means that when it comes to causing global warming, carbon dioxide is without question the most important greenhouse gas. |
|
| + -
Hasn’t Earth warmed and cooled naturally throughout history? Yes. Earth has experienced cold periods (or “ice ages”) and warm periods (“interglacials”) on roughly 100,000-year cycles for at least the last 1 million years. The last of these ices ended around 20,000 years ago. Over the course of these cycles, global average temperatures warmed or cooled anywhere from 3° to perhaps as much as 8° Celsius (5°-15° Fahrenheit). [47] [48] [30] [49] It was partly through their attempts to understand what caused and ended previous ice ages that climate scientists came to understand the dominant role that carbon dioxide plays in Earth’s climate system, and the role it is playing in current global warming. Learn more here and here. More detail: Over at least the past million years, glacial and interglacial cycles have been triggered by variations in how much sunlight reaches the Northern Hemisphere in the summer, which are driven by small variations in the geometry of Earth’s orbit around the Sun. But these fluctuations in sunlight aren’t enough on their own to bring about full-blown ice ages and interglacials. They trigger several feedback loops that amplify the original warming or cooling. During an interglacial,
These feedbacks amplify the initial warming until the Earth’s orbit goes through a phase during which the amount of Northern Hemisphere summer sunlight is minimized. Then these feedbacks operate in reverse, reinforcing the cooling trend. |
|
| + -
Doesn’t carbon dioxide in the atmosphere come from natural sources? Yes, there are natural sources of atmospheric carbon dioxide, such as outgassing from the ocean, decomposing vegetation and other biomass, venting volcanoes, naturally occurring wildfires, and even belches from ruminant animals. These natural sources of carbon dioxide are offset by “sinks”—things like photosynthesis by plants on land and in the ocean, direct absorption into the ocean, and the creation of soil and peat. During all the ice ages that have occurred over at least the past million years, these opposing branches of the carbon cycle have kept the atmospheric carbon dioxide level at or below 300 parts per million (ppm). [33] Today, that level is close to 410 ppm. Not only is this the highest carbon dioxide has been during all of human civilization, it has reached these levels virtually instantaneously in geologic time frames. During ice age cycles of the past, a change this large would likely have taken thousands of years to occur. This extremely rapid build-up of carbon dioxide is happening because humans are putting carbon dioxide into the atmosphere faster than natural sinks can remove it. By burning fossil fuels, we have essentially taken millions of years of carbon uptake by plants and returned it to the atmosphere in less than 300 years. [30] |
|
| + -
Do volcanoes emit more carbon dioxide than humans? No, human activities emit 60 or more times the carbon dioxide that volcanoes do in a typical year. Estimates for carbon dioxide emissions from volcanoes range from 0.3 (plus or minus 0.15) billion metric tons of carbon dioxide per year [23] to perhaps as much as 0.6 billion metric tons [22], whereas human activities have been releasing more than 30 billion metric tons of carbon dioxide per year since 2010. [24] Learn more. |
|
| + -
Couldn’t the Sun cause the globe to warm? If the Sun were to intensify its energy output then, yes, it would warm our world. Indeed, sunspot data indicate there was a small increase in the amount of incoming sunlight between the late 1800s and the mid-1900s that experts estimate contributed to at most up to 0.1°C of the 1.0°C (1.8°F) of warming observed since the pre-industrial era. [27] However, there has been no significant net change in the Sun’s energy output from the late 1970s to the present, which is when we have observed the most rapid global warming. Learn more. A second reason that scientists have ruled out a significant role for the Sun in global warming is that if the Sun’s energy output had intensified, we would expect all layers of Earth’s atmosphere to have warmed. But we don’t see that. Rather, satellites and observations from weather balloons show warming in the lower atmosphere (troposphere) and cooling in the upper stratosphere (stratosphere)—which is exactly what we would expect to see as a result of increasing greenhouse gases trapping heat in the lower atmosphere. [46] Scientists regard this piece of evidence as one of several “smoking guns” linking today’s global warming to human-emitted, heat-trapping gases. |
|
| + -
Do humans also exert a cooling influence on Earth’s climate? Yes, humans exert a cooling influence on Earth in several ways. But, overall, these cooling influences are smaller than the warming influence of the heat-trapping gases humans put into the air. [34] Our greatest cooling influence comes from particulate pollution (aerosols) we produce. We put plumes of aerosols into the air from power plants and industrial smokestacks; smoke and gases from biomass burning; windblown dust from deforested areas, dried wetlands, and crop fields; exhaust from ships’ smokestacks; tailpipe emissions from cars, trucks, buses, and trains; etc. Aerosol particles absorb and reflect the sun’s rays, thereby reducing the amount of sunlight reaching Earth’s surface. They also interact with clouds, in many cases making them brighter and longer-lived, also reducing the amount of sunlight reaching the surface. Learn more. Whereas aerosols linger in the atmosphere from days to a few weeks, heat-trapping gases that we add to the atmosphere linger from decades to centuries. Plus, when scientists discovered that our aerosol emissions were causing other undesired harmful side effects—such as acid rain and human respiratory diseases and deaths—we began to regulate and reduce their emission. Thus, the warming effect of our heat-trapping gases is ultimately winning out over the cooling influence of our particle pollution. Learn more. |
|
| + -
What role does the ocean play in global warming? The ocean has absorbed between 20–30 percent of all human-produced carbon dioxide emissions since the 1980s. This absorption has kept large amounts of this heat-trapping gas out of the atmosphere, making the rate of warming slower than it would otherwise be, but it has also lowered the pH (increased the acidity) of ocean surface waters. Ocean acidification makes it harder for shell-building marine life—including commercially and culturally valuable species such as coral, crabs, and oysters—to build and maintain their shells. [1] Because of its tremendous volume and high heat capacity, the ocean has absorbed more than 90 percent of all excess heat trapped in Earth's climate system by greenhouse gases. Currents mix much of that heat into deeper layers of the ocean, delaying the full impact of surface warming we would otherwise expect. However, the heating of deeper layers of the ocean still contributes to sea level rise, sea ice retreat, marine heatwaves, oxygen depletion and expanding dead zones, shifts in the ranges of several marine species, and accelerating loss of polar ice shelves. [1] |
|
| Impacts | |
| + -
Does global warming mean it’s warming everywhere? No, “global warming” means Earth’s annual average air temperature is rising over long time spans (many decades to centuries), but not necessarily in every location and not necessarily in all seasons. It’s like your grades—if you get Bs and Cs in your first semester and in the next semester you get all As and Cs, your overall grade point average rises even though you didn’t improve in every class. Differences in exposure to sunlight, cloud cover, atmospheric circulation patterns, aerosol concentrations, atmospheric humidity, land surface cover, etc., all vary from place to place which, in turn, influence whether and how much a location is warming or cooling. Learn more here, here, here, and here. |
|
| + -
What is an "extreme event"? Scientists can characterize an extreme event in three different ways:
More details: Generally speaking, an extreme event is any event that ranks in the highest or lowest 5 percent or 10 percent of all historical observations of that type of event. The percentage threshold is arbitrary and is designated by a researcher to provide context on a given event or set of events. Scientists sometimes describe extreme events in terms of their “sigmas” (or their “standard deviation”), which is a measure of how far removed an individual value is from the average of all observations in a data set. So, if a climate expert describes a heavy rain event as a “5-sigma event,” s/he is talking about rainfall so extreme that it was 5 standard deviations away from the average rainfall for that location—way out at the tail end of the range of all values that have ever been observed. Learn more. Another way of characterizing an extreme event is by describing the probability of occurrence in a given span of time. Based on historical observations, experts can use statistics to estimate the range of all possible events that we would eventually expect to observe if our data record was long enough. From this range of all possible values, they can pinpoint how frequently a particular value would be expected to recur within a given amount of time. For example, 100-year event means an event is so extreme that it has only a 1 percent chance (1 divided by 100) of happening in any given year. A thousand-year event has a 0.1 percent chance of happening in any single year (1 divided by 1,000). Learn more. |
|
| + -
Was this or that extreme weather or climate event caused by global warming? To date, climate research has yet to show that any given event was caused solely by global warming. However, over the past decade, research has demonstrated that climate change due to global warming has made many extreme events more likely, more intense, longer-lasting, or larger in scale than they would have been without it. For many of the events that have been studied, global warming has been identified as the primary driver of the event, not just a supporting player. And a number of recent studies have concluded that certain heat-related extreme events would not have been possible without human-caused global warming. Learn more here and here. Extreme event attribution is the science of figuring out what caused a given extreme weather or climate event, and weighting the relative influence of global warming versus natural variability. The biggest collection of research dedicated to understanding the causes of extreme events is published annually in a special issue of the Bulletin of the American Meteorological Society. The most recent edition of the report, Explaining Extreme Events in 2018 from a Climate Perspective, was the eighth in the series. (The report covering a selection of events from 2019 is soon to be released). Together, these eight reports have documented 168 attribution studies, 73 percent of which identified a substantial link between an extreme event and human-caused climate change, whereas 27 percent did not. To learn more, go here and here. |
|
| + -
If Earth has warmed and cooled naturally, why are scientists so concerned about today’s global warming? Experts are concerned about today’s global warming because it is different from previous warming periods in three key ways: the reason, the rate, and the repercussions. Ice ages and warm periods over the past million years or more were triggered by variations in the amount of sunlight reaching the Northern Hemisphere during summer and then amplified by other climate feedbacks. But today’s warming is mainly due to humans increasing the abundance of heat-trapping gases in the atmosphere. [1] Today’s warming is occurring much more quickly than previous interglacial episodes. In transitions from an ice age to an interglacial, it took 5,000–10,000 years for the temperature to rise between 5 and 9° Fahrenheit (3–5° Celsius). Humans could witness the same amount of global warming within the next 80 years if we continue emitting heat-trapping gases at today’s rate. [1] Finally, if we cause our world to warm by 2.7°F (1.5°C) or more compared to the temperatures before the start of the Industrial Revolution, scientists warn that there will be harmful repercussions for human health, the economy, infrastructure, and agriculture and natural resources. [4] The greater the warming above that threshold, the more widespread and severe the impacts are likely to be. Human and natural systems that cannot adapt quickly enough may be overwhelmed. |
|
| + -
A global warming of 1.8°F (1°C) seems small, given that some locations experience temperature swings of 30°F or more in a single day. Why is this change in global temperature a concern? Daily temperature swings of tens of degrees at a given location are common weather-driven events. But historically, when measurements of the daily high and low temperatures from many thousands of locations all over the world are averaged together over a whole year, the Earth's annual average temperature fluctuated by no more than a few tenths of a degree from year to year. In a geological context, a global-scale warming of 1.8°F (1°C) in less than 150 years is an unusually large temperature change in a relatively short span of time. It's also important to recognize that Earth is not warming uniformly, nor is it expected to. Middle and high latitudes in general will warm more than the tropics, and land surface temperatures will rise more than ocean temperatures. Over the long term, land masses at the latitude of the United States are expected to warm much more than the global average. [17] If global warming continues at an increasing rate, in several decades the world is likely to be warmer than it's been for over a million years, with unpredictable consequences for humans and the natural resources we depend on. |
|
| + -
How will global warming harm human health and well-being in the United States?
More U.S. impacts. More global impacts. |
|
| + -
How will global warming harm natural and agricultural resources in the United States? The ability of forests and other ecosystems to provide culturally and economically important services—timber, water supply protection, livestock forage, recreation, fisheries, and hunting—are likely to decline as a result of human-caused climate change due to increased disturbance from water stress, fires, pest outbreaks, invasive species, heat stress, ocean acidification, and drought. These negative impacts will increase with higher rates of warming. [36] [37] [38] In terms of biodiversity, adaptable species with wide geographic ranges—such as white-tailed deer and feral hogs—are likely to continue to thrive. But those species that depend on particular habitats—polar and alpine species, coral reefs, coldwater fishes—are vulnerable, as are the communities that depend on them culturally and economically. [8] According to the Fourth National Climate Assessment, “[S]pecies, including many iconic species, may disappear from regions where they have been prevalent or become extinct, altering some regions so much that their mix of plant and animal life will become almost unrecognizable.” [38] Food and forage production will decline in agricultural regions experiencing increased frequency and duration of drought. Even without drought, higher temperatures will increase evaporation of soil moisture, increasing crop stress and water demand—further stressing U.S. surface and groundwater supplies used for irrigation. And even with irrigation, many commodity crops are likely to experience declines in average yield as temperatures rise beyond their preferred heat tolerance range. Milder winters and shifts in precipitation are likely to increase the incidence of pests and diseases for crops and livestock, while extreme heat—especially nighttime heat—will reduce livestock productivity. Impacts will vary from region to region, depending on the extent of warming and the level of adaptation. [39] |
|
| + -
How will global warming harm U.S. communities, infrastructure, and the economy? Nationwide, the cost of weather and climate-related disasters is already rising, [40] and the trend is likely to continue as many extreme events become more frequent and severe. The economic impacts of extreme events include not just the direct damages, but also the loss of productivity and interruption of essential services and supply chains that can reach deep into the national economy. [41] In many parts of the country, existing infrastructure—septic and stormwater systems, roads, bridges, the energy grid—was not designed to cope with current and future sea level and climate extremes, and current levels of investment aren’t enough to cover necessary repairs and upgrades. [41] [42] Beyond extreme events, human-caused climate change is likely to disrupt many sectors of the U.S. economy and the communities that depend on them, including commercial and recreational fisheries, tourism and recreation, and agriculture. [39] [37] [43] |
|
| + -
Are there benefits from global warming? Yes, there will probably be some short-term and long-term benefits from global warming. For example, the flip side of increased mortality from heat waves may be decreased mortality from cold waves. In the short term, farmers in some regions may benefit from the earlier onset of spring and from a longer warm season that is suitable for growing crops. Also, studies show that, up to a certain point, crops and other plants grow better in the presence of higher carbon dioxide levels and seem to be more drought-tolerant. [1] But this benefit is a two-edged sword: weeds, many invasive plant species, and insect pests will also thrive in a warmer world. Water availability will be impacted in drier agricultural areas that need irrigation. At some point, the benefits to crops of increased carbon dioxide will likely be overwhelmed by the negative impacts of heat stress and drought. In the long term, shipping commerce will benefit from the opening of the Northwest Passage for longer periods of the year due to the loss of Arctic sea ice. However, in the long run, if a "business as usual" approach to emitting heat-trapping gases is maintained at the present rate, or faster, then the negative costs and impacts of global warming are very likely to far outweigh the benefits over the course of this century, with increased potential for catastrophic impacts from more extreme events. [17] In part, this is because any substantial change, whether warmer or colder, would challenge the societal infrastructure that has developed under the current climate. |
|
| Actions | |
| + -
Can we slow or stop human-caused global warming? Yes. While we cannot stop global warming overnight, or even over the next several decades, we can slow the rate and limit the amount of global warming by reducing human emissions of heat-trapping gases and soot (“black carbon”). [9] If all human emissions of heat-trapping gases were to stop today, Earth’s temperature would continue to rise for a few decades as ocean currents bring excess heat stored in the deep ocean back to the surface. Once this excess heat radiated out to space, Earth’s temperature would stabilize. Experts think the additional warming from this “hidden” heat is unlikely to exceed 0.9° Fahrenheit (0.5°Celsius). [44] With no further human influence, natural processes would begin to slowly remove the excess carbon dioxide from the atmosphere, and global temperatures would gradually begin to decline. It’s true that without dramatic action in the next couple of decades, we are unlikely to keep global warming in this century below 2.7° Fahrenheit (1.5° Celsius) compared to pre-industrial temperatures—a threshold that experts say offers a lower risk of serious negative impacts. [44] But the more we overshoot that threshold, the more serious and widespread the negative impacts will be, which means that it is never “too late” to take action. |
|
| + -
What actions can we take to stop or slow global warming? There is no one-size-fits-all approach to stopping or slowing global warming, and each individual, business, municipal, state, tribal, and federal entity must weigh their options in light of their own unique set of circumstances. Experts say it is likely many strategies working together will be needed. Generally speaking, here are some examples of mitigation strategies we can use to slow or stop the human-caused global warming (learn more):
Note that NOAA doesn’t advocate for or against particular climate policies. Instead, NOAA’s role is to provide data and scientific information about climate, including how it has changed and is likely to change in the future depending on different climate policies or actions society may or may not take. Learn more here, here, and here. |
|
| + -
What actions can we take to adapt to global warming? In terms of adaptation, there is no one-size-fits-all approach and each individual, business, municipal, state, tribal, and federal entity must weigh their options in light of their own unique set of circumstances. Generally speaking, here are examples of the types of adaptation actions communities and businesses can take to help them better understand, minimize, or avoid harmful climate-related impacts (learn more):
Note that NOAA doesn’t advocate for or against particular climate policies. Instead, NOAA’s role is to provide data and scientific information about climate, including how it has changed and is likely to change in the future depending on different climate policies or actions society may or may not take. Learn more here, here, and here. |
|
| + -
What is NOAA's climate mission? NOAA is an agency that enriches life through science. We provide foundational climate science, data, and information that Americans want and need. Without NOAA’s climate monitoring, research, and modeling capabilities we couldn’t quantify where and how climate conditions have changed, nor could we predict where and how they’re likely to change. NOAA is helping to improve the nation’s resilience to changes in climate and weather. Specifically, NOAA is working to…
|
|
| References | |
|
|