And that’s a wrap on this season’s stratospheric polar vortex
As polar vortex season winds down, so does Season 1 of the Polar Vortex Blog. In our final post of the season, we discuss whether the season is ending on a cliffhanger or just tying up loose ends.
Season finale of the polar vortex
The polar stratospheric west-to-east winds have been steadily weakening and as of April 28, the winds at 60 degrees North, 10-hPa reversed direction, becoming east-to-west. As mentioned in the previous post, this breakdown of the polar vortex isn’t a shocking cliffhanger, but rather the final stratospheric warming that occurs every spring as a result of the sun “rising” over the North Pole. Probably the most noteworthy part of the final warming is that it happened later than normal (on average, it’s April 12). But this was expected because the final warming sometimes occurs later if a major warming event occurs in March.
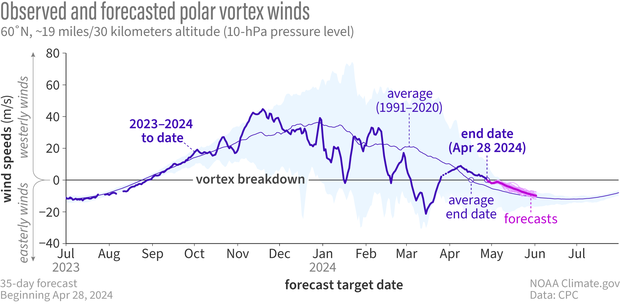
Observed and forecasted (NOAA GEFSv12) wind speed at the 10-hPa pressure level and the 60-degrees North latitude circle. The final stratospheric warming occurred on April 28 (where thick magenta line falls below 0 m/s), 16 days later than normal (where the thin purple line falls below 0 m/s and stays there through summer). NOAA Climate.gov image, adapted from original by Laura Ciasto.
Tying together all the atmospheric storylines
If the winter climate were a TV series, then we can think of the major climate phenomena as the atmospheric storylines of the season. And this winter had some exciting storylines including the very active stratosphere polar vortex and the El Niño. The reason why we pay attention to this climate show is that these storylines can impact our weather throughout the winter. But what impact, if any, did these climate phenomena have on our 2024 winter?
This question of attribution is tricky to conclusively address without more extensive analysis and modeling experiments [footnote #1]. Nevertheless, we can get some idea by examining the temperature pattern observed this past winter (focusing on January-March) and comparing it with the typical temperature patterns associated with the different climate phenomena.
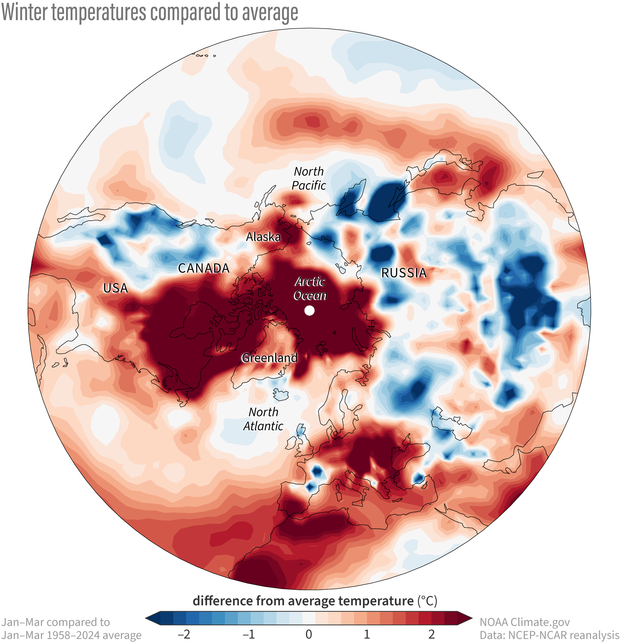
January-February-March temperatures compared to the 1958-2024 average across the Northern Hemisphere. NOAA Climate.gov image, adapted from original by Amy Butler.
So let’s start with the observed temperature anomalies (the departure from the 1958-2024 average temperatures) for January-March. Much of the United States (and the Northern Hemisphere) experienced warmer than average temperatures. Some of this abnormal warmth comes from the long-term global warming trend, the overarching storyline that steers the overall theme of the climate show every winter. By removing the linear component of the warming trend, we can focus on the other major stories of this particular season beyond global warming’s big role [footnote #2].
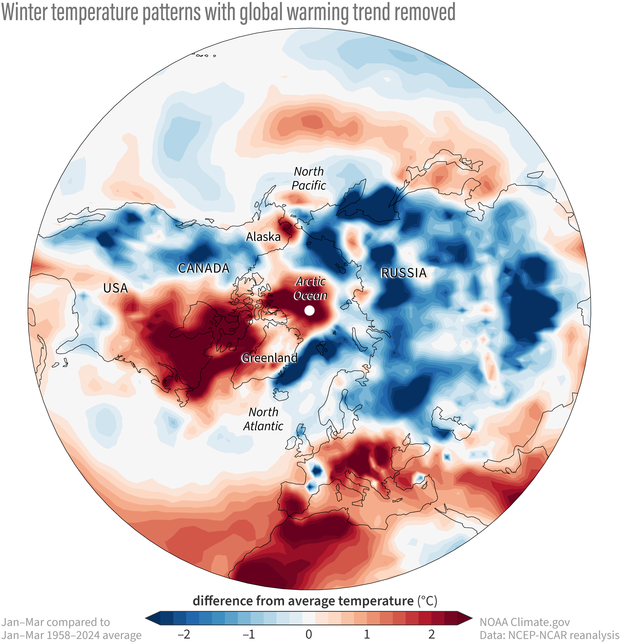
January-February-March temperature departures from the 1958-2024 average across the Northern Hemisphere with the linear temperature trend removed (also called detrended; footnote #2). NOAA Climate.gov image, adapted from original by Amy Butler.
Once we remove the linear part of the trend, it’s evident that many parts of the hemisphere are still warmer than average, including northeastern North America, Alaska, Europe and northern Africa. But not everywhere was abnormally warm. Most of Asia and the western and southeastern United States were colder than normal during January-March. Did any climate phenomena play a role in shaping this temperature map? Since this is a polar vortex blog, we’re definitely curious about the role of the major sudden stratospheric warmings, but there’s another big star of the winter climate that won’t be ignored.
The “A” Storyline
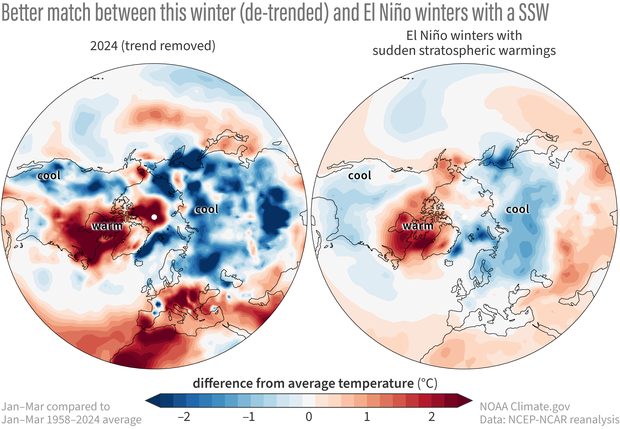
The storyline that often sets the tone of the season is the El Niño Southern Oscillation (ENSO), and for this particular season, it’s El Niño. If you hang out on the ENSO blog, you’ve probably seen that temperatures during El Niño winters are more frequently colder than average in the southern regions and warmer than average in northern regions of the US. In the analysis below, only El Niño winters without major sudden stratospheric warming events are included so we can see the El Niño-related temperatures when the stratospheric polar vortex wasn’t acting up.
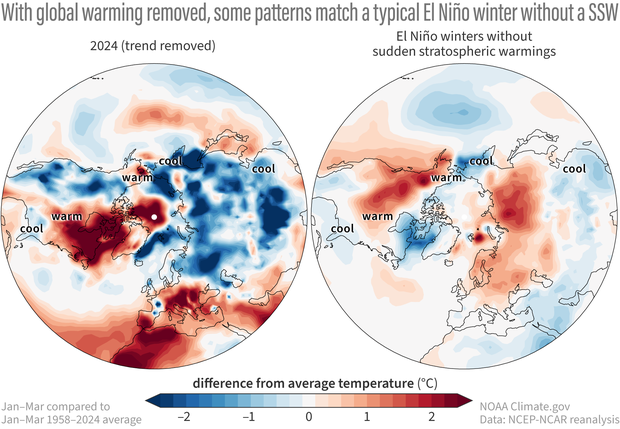
If it weren’t for global warming, how much would this winter temperature pattern look like a typical El Niño winter when the stratospheric polar vortex winds didn’t break down? (left) Detrended January-March temperature anomalies during 2024 (same as the figure above) and (right) the average temperature anomalies during January-March El Niño winters (1958-2024) when no major sudden stratospheric warmings occurred. Anomalies correspond to departures from the 1958-2024 average temperatures. Similarities exist between the two figures particularly over North America, suggesting El Niño’s influence on winter temperatures. Note that the amplitude of the 2024 temperature pattern is much larger because it’s a single year rather than the El Niño temperature pattern which is averaged over numerous years. NOAA Climate.gov image, adapted from original by Amy Butler.
If we compare the El Niño winters without major stratospheric warming events to the observed, detrended temperatures for January-March, there are some similarities. For example, the colder than average temperatures in the southern United States and southern half of Asia as well as the warm over northern United States and Alaska are consistent with El Niño. But we’re still not getting the whole story. Something is missing.
The plot twist
If El Niño is often the main storyline of the season, then major stratospheric warmings are the suspenseful plot twists. Will it or won’t it happen? Will it or won’t it have an impact on our weather? When these major stratospheric warmings do occur, they can modulate the El Niño storyline and affect the temperature pattern.
If it weren’t for global warming, how much would this winter temperature pattern look like a typical El Niño winter when the stratospheric polar vortex winds do break down? (left) De-trended January-March temperature anomalies during 2024 (same as the left figure above) and (right) the average temperature anomalies during January-March El Niño winters (1958-2024) when at least one major sudden stratospheric warmings occurred. Anomalies correspond to departures from the 1958-2024 average temperatures. The two figures share many features over North America, Europe, and Asia, suggesting the modulation of El Niño’s influence on winter temperatures by the stratospheric polar vortex. Note that the amplitude of the 2024 temperature pattern is much larger because it’s a single year rather than the El Niño temperature pattern which is averaged over numerous years. NOAA Climate.gov image, adapted from original by Amy Butler.
If we now compare this year’s detrended temperature patterns with the El Niño winters that had at least one major stratospheric warming event, then the story begins to look more like what we saw this winter. The warmer than normal temperatures over the Northeast and the colder than normal temperatures over the west coast and Asia are more consistent with this year's pattern than if we just looked at El Niños without major warmings [footnote #3].
Of course, even after detrending, the temperature patterns we observed don’t match an El Niño storyline with a stratospheric plot twist exactly. Nor would we expect it to. No winter is an exact re-run of another. Like all TV shows, there are many other things going on in the winter, including phenomena like the Madden Julian Oscillation (the B storyline) or shorter-lived fronts, troughs, ridges, and cut-off lows (special guest stars).
Understanding why the winter temperature patterns look the way they do is much more complicated than looking at average ENSO and polar vortex temperature plots. Still, the analysis above makes a solid case that ENSO and the stratosphere had some impact on the January-March temperature pattern.
Fall Preview
With the stratospheric winds primarily east-to-west, and thus de-coupled from the troposphere [footnote #4], there won’t be as much for us to write about until the fall when the polar vortex returns. So we’ll be back then with more exciting things about the polar vortex…perhaps introducing new characters like ozone or the Southern Hemisphere stratosphere polar vortex. Until then…that’s a wrap on Season 1 of the Polar Vortex Blog!
Footnotes
[1] Our friends at the ENSO blog wrote a really nice post about the challenges of attribution (identifying the impacts from different climate phenomena on a particular forecast or event). Check out their post, especially if you’re a fan of cats! You can also check out the seasonal forecast attribution analysis project led by Arun Kumar and Mingyue Chen at NOAA CPC.
[2] To get a little technical, we removed the linear trend through a process called linear least squares best fit. At each grid point, we can calculate how much the temperature has changed over the course of the record (in this case 1958-2024) and then multiply that change by the number of years in the record. That value is then subtracted from the January-March temperature. The resulting temperature value is thus “detrended”. Using this method removes a substantial amount of the climate change trends in temperature, but that may not be true for other variables.
[3] Over the historical period (1958-2024), there are more years with both an El Niño and a sudden stratospheric warming (12 years including 2024) than El Niño without a sudden stratospheric warming (9 years). That’s because El Niño itself increases the probability that a sudden stratospheric warming will occur. We talked about this in more detail in a previous post.
[4] If you remember from our post on the polar vortex disruptions and stratosphere-troposphere coupling, the atmospheric waves that disrupt the polar vortex can only travel vertically if the stratospheric winds are blowing from west-to-east. This means that any atmospheric waves trying to move upwards will hit the stratospheric barrier of the summertime east-to-west winds.
Comments
Thanks
This was an informative post in an informative series. Thanks for your hard work.
Thank you!
Glad you have enjoyed our posts. Hope you come back next fall!
Proof that....
Global Warming is actually occurring please, and it's here to stay. I've heard this for 73 years and would like an answer or link that's not political. Enjoyed your articles on the Polar Vortex this past year.
Re: Proof that...
Hi Stephen,
I'm glad you've enjoyed the blog! NOAA scientists and education and outreach websites like Climate.gov are passionately committed to understanding the weather, the oceans, and the climate system and sharing that knowledge with the public, without political bias or influence.
Thus, anything you find on Climate.gov about global warming is based only on the science itself--the thousands of peer-reviewed papers and reports that are written by actual scientists from all kinds of places (universities, government labs and research centers, private energy companies--including fossil fuel corporations!) from all over the world.
If you are looking for a broad view of the causes and impacts of global warming, I suggest you explore our Global Climate Dashboard. If you prefer a more question-focused approach, I suggest our Climate Q&A department.
There are many other sources of credible information about global warming and climate change available online. If you want a deep dive into how scientists came to understand global warming, I recommend the history-based approach by physicist Spencer Weart. He has a physical book and an online supplement:
https://history.aip.org/climate/index.htm
Thanks Rebecca for...
your reply. I finally received answers on climate change from the links you kindly sent. Looking forward to many great articles on the Polar Vortex Blog.
Stephen S.
Northern Polar Cap Ozone still wicked high
I realize your done for the season but the ozone level still real curious
https://ozonewatch.gsfc.nasa.gov/meteorology/figures/ozone/to3capn_2023…
total ozone over the Arctic
Great observation, the NH polar cap ozone has been well above average for the last several months. This is common during active polar vortex years and we had a very active year with multiple weakenings of the stratospheric polar vortex winds. The weaker west-to-east winds allows more ozone to be transported into the polar lower stratosphere. It's curious that the ozone is still above normal, but then again, maybe it's not too surprising given just how active the polar vortex was this year.
Add new comment