2023: A historic year of U.S. billion-dollar weather and climate disasters
The NOAA National Centers for Environmental Information (NCEI) has released the final update to its 2023 Billion-dollar disaster report, confirming a historic year in the number of costly disasters and extremes throughout much of the country. There were 28 weather and climate disasters in 2023, surpassing the previous record of 22 in 2020, tallying a price tag of at least $92.9 billion. This total annual cost may rise by several billion when we’ve fully accounted for the costs of the December 16-18 East Coast storm and flooding event that impacted states from Florida to Maine.
2023 Highlights
In 2023, the U.S. experienced 28 separate weather and climate disasters costing at least 1 billion dollars. That number puts 2023 into first place for the highest number of billion-dollar disasters in a calendar year and included:
- 1 winter storm/cold wave event (across the northeast U.S. in early-February).
- 1 wildfire event (firestorm destroying town of Lahaina on Maui Island of Hawaii).
- 1 drought and heat wave event (focused across the central and southern U.S.).
- 4 flooding events (in California, Florida, and across the eastern and northeastern U.S.).
- 2 tornado outbreaks (across the central and eastern U.S.).
- 2 tropical cyclones (Idalia in Florida and Typhoon Mawar in Guam).
- 17 severe weather/hail events (across many parts of the country).
2023 was also deadly, causing at least 492 direct or indirect fatalities—the 8th most disaster-related fatalities for the contiguous U.S. since 1980.
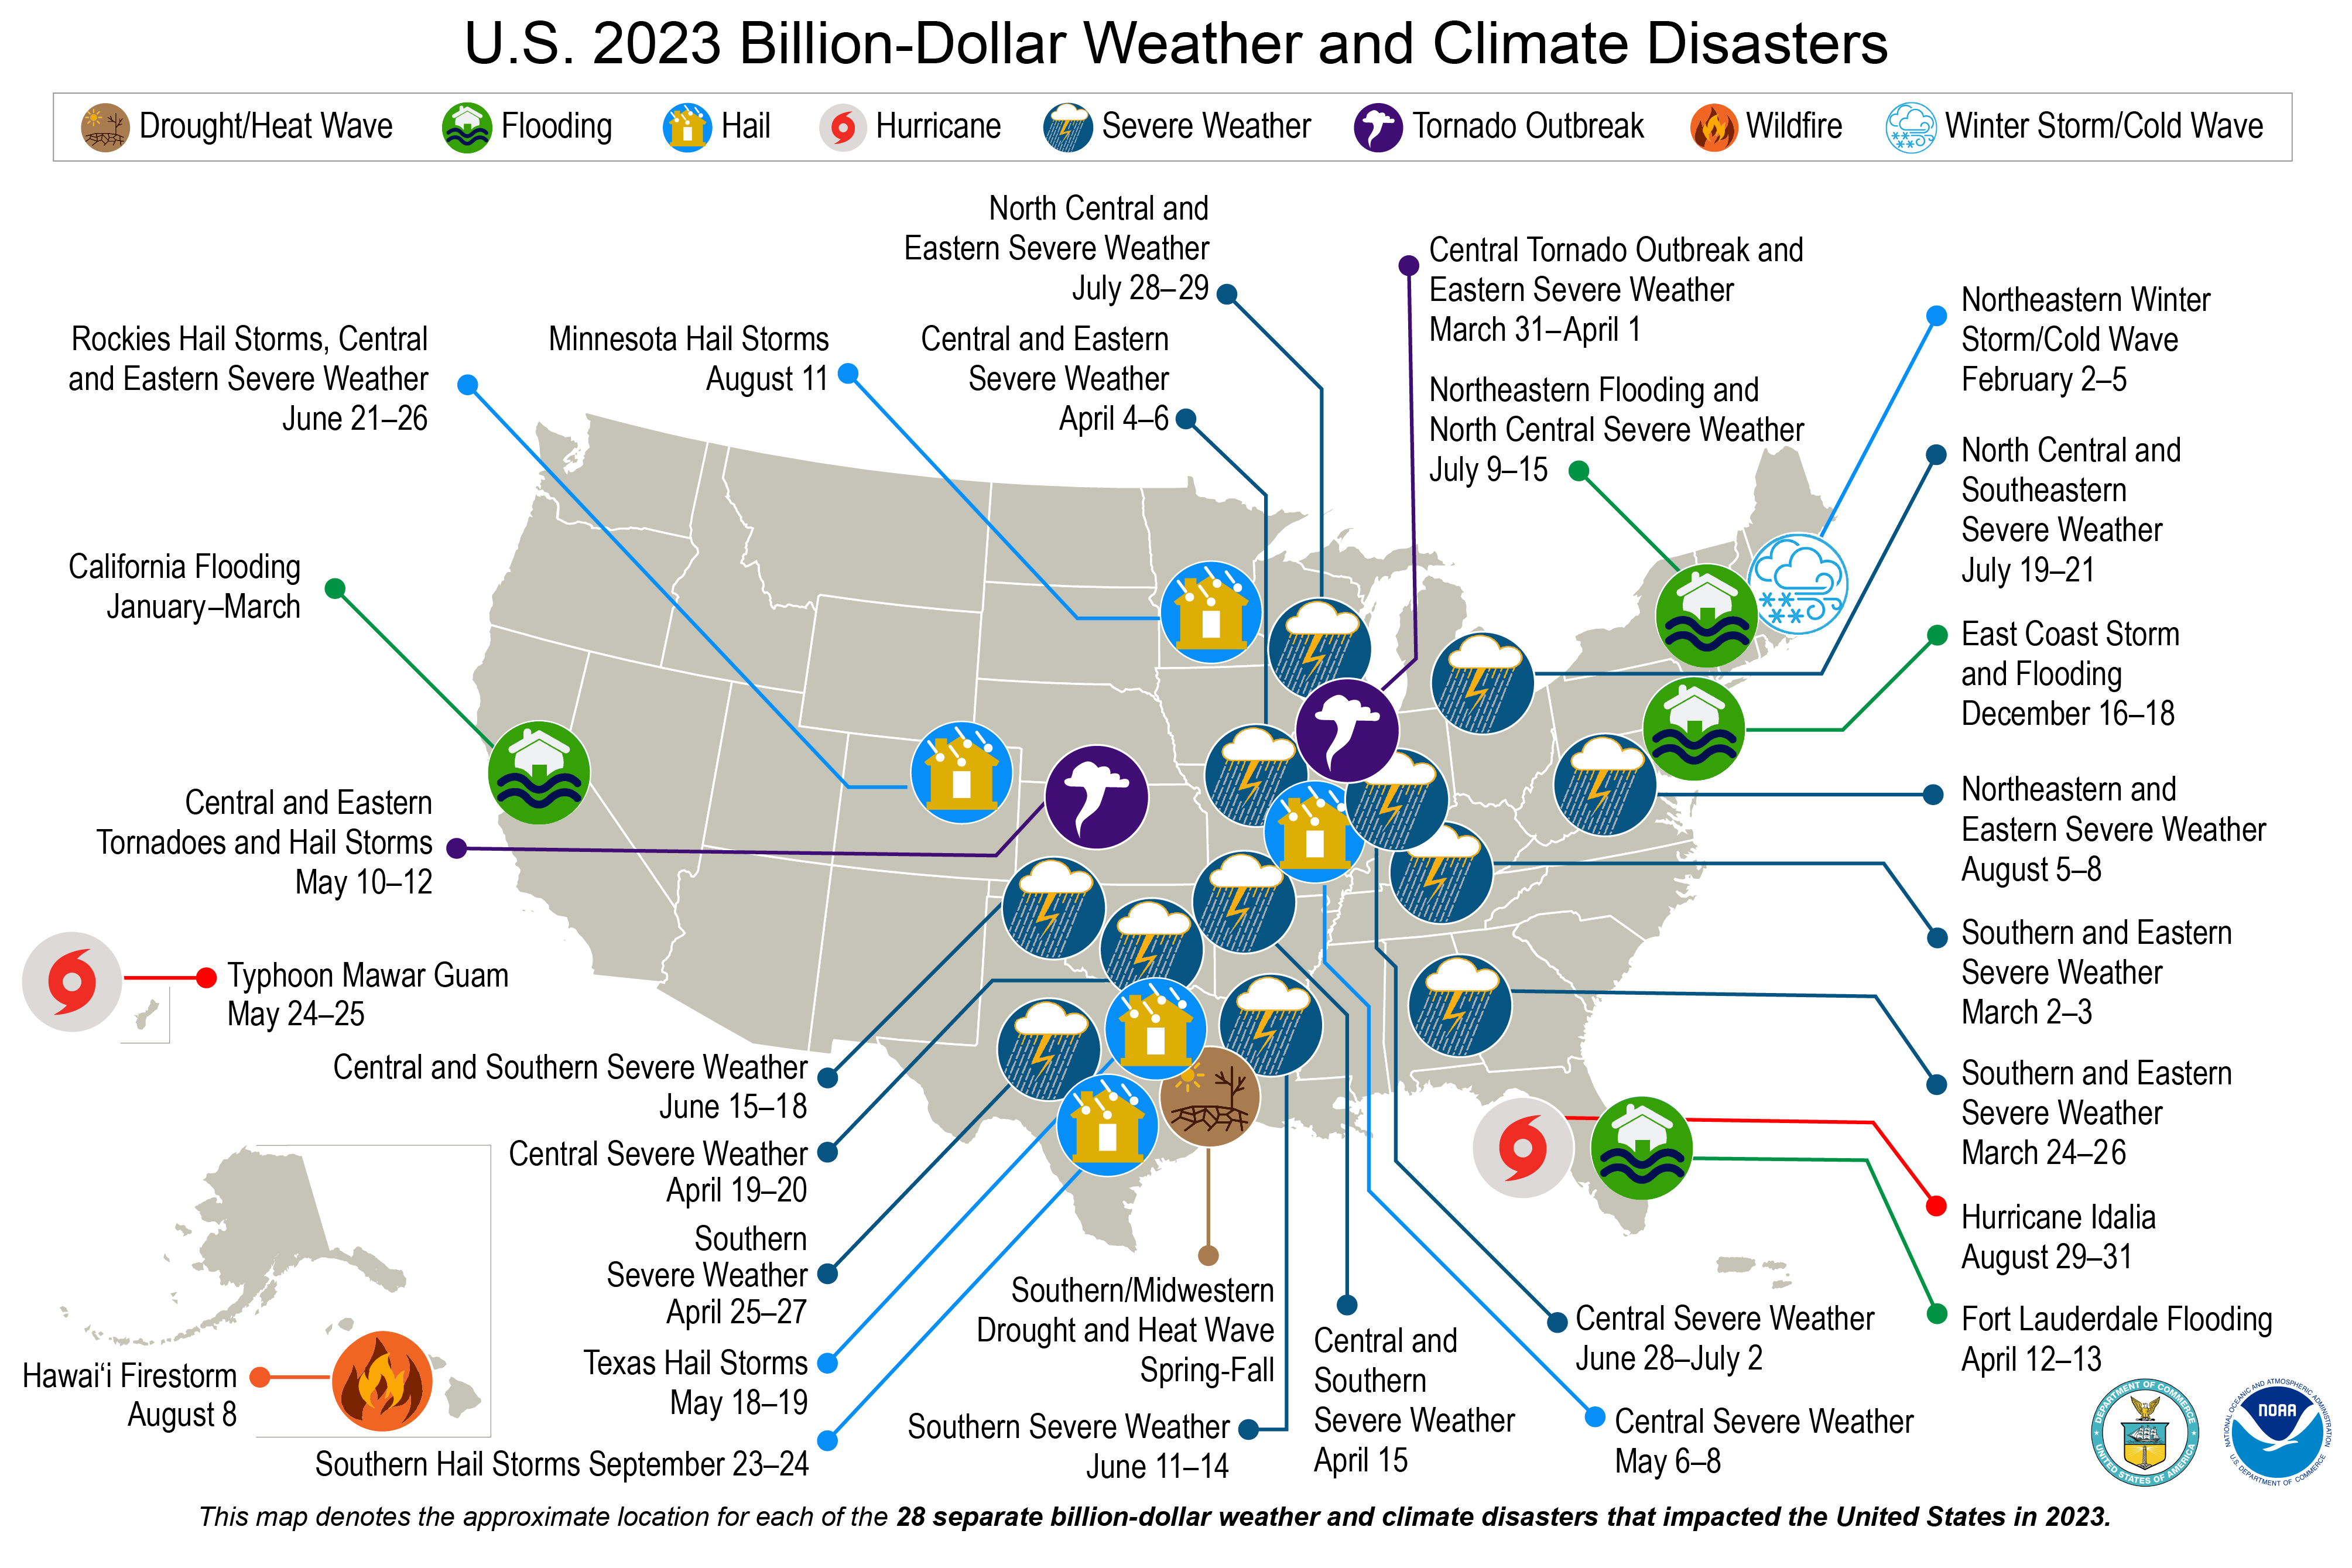
In 2023, the United States experienced 28 separate weather or climate disasters that each resulted in at least $1 billion in damages. NOAA map by NCEI.
Damages from the 2023 disasters totaled $92.9 billion. (All cost estimates are adjusted based on the Consumer Price Index, 2023). The costliest 2023 events were the Southern / Midwestern Drought and Heat Wave ($14.5 billion) and the Southern and Eastern Severe Weather in early March ($6.0 billion). Adding the 2023 events to the record that began in 1980, the U.S. has sustained 376 weather and climate disasters with the overall damage costs reaching or exceeding $1 billion. The cumulative cost for these 376 events exceeds $2.660 trillion.
2023 costs in historical context
As with all years of the 2020s decade, 2023 was another very active year, featuring a high frequency, high cost, and large diversity of extreme events that affect people's lives and livelihoods. 2023 (red line) is the fourth consecutive year (2020-2023) in which 18 or more separate billion-dollar disaster events have impacted the U.S., marking a consistent pattern that is becoming the new normal. The 1980–2023 annual average (black line) is 8.5 events (CPI-adjusted); the annual average for the most recent 5 years (2019–2023) is 20.4 events (CPI-adjusted).
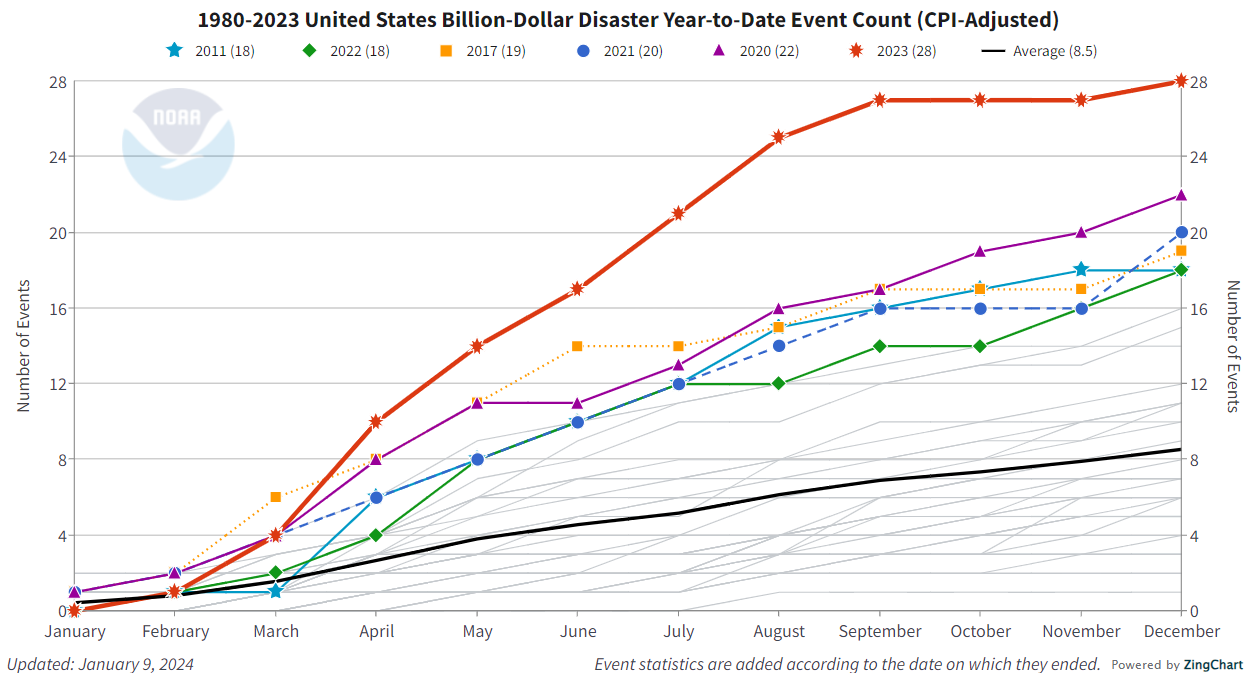
Month-by-month accumulation of billion-dollar disasters for each year on record. The colored lines represent the top 6 years for most billion-dollar disasters. All other years are colored light gray. NOAA image by NCEI.
Over the last seven years (2017-2023), 137 separate billion-dollar disasters have killed at least 5,500 people and cost >$1 trillion in damage. One of the drivers of this cost is that the U.S. has been impacted by landfalling Category 4 or 5 hurricanes in five of the last seven years, including Hurricanes Harvey, Irma, Maria, Michael, Laura, Ida, and Ian. The U.S. was spared a major hurricane impacting a major metropolitan area in 2023, as Category 3 Hurricane Idalia made landfall in the less populated Big Bend region of Florida.
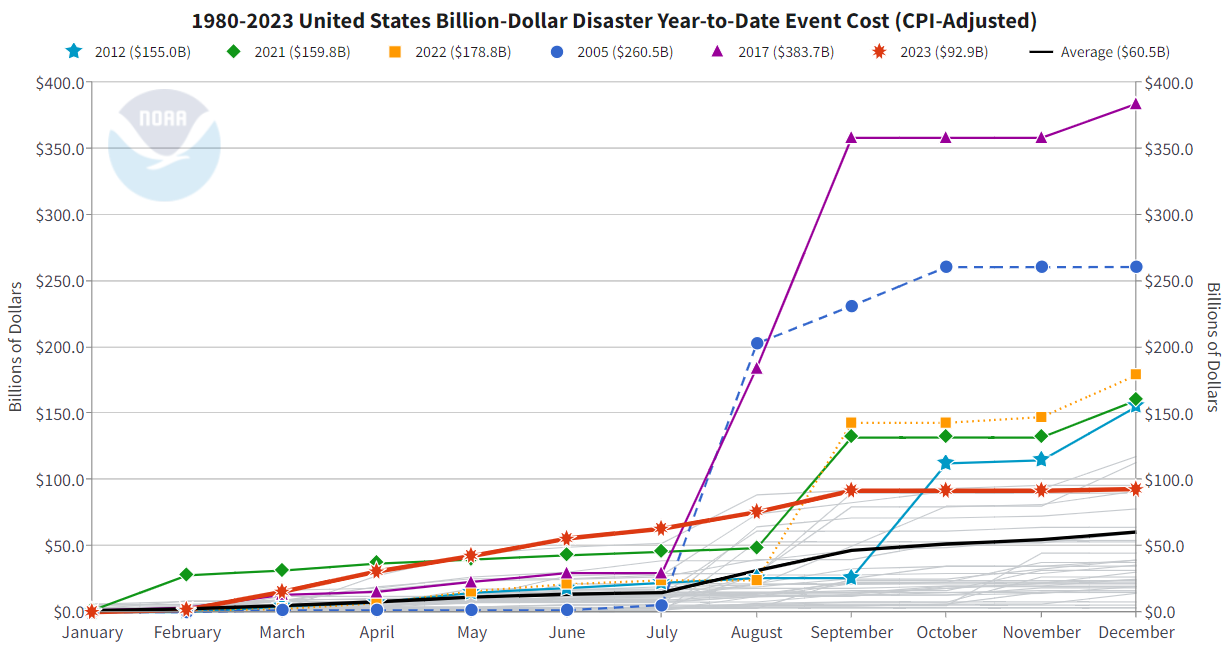
Month-by-month accumulation of estimated costs of each year's billion-dollar disasters, with colored lines showing 2023 (red) and the previous top-10 costliest years. Other years are light gray. 2023 finished the year in tenth place for annual costs. NOAA image by NCEI.
In broader context, the total cost of U.S. billion-dollar disasters over the last 5 years (2019-2023) is $603.1 billion, with a 5-year annual cost average of $120.6 billion, the latter of which is more than double the 44-year inflation-adjusted annual average cost. The U.S. billion-dollar disaster damage costs over the last 10-years (2014-2023) were also historically large: at least $1.2 trillion from 173 separate billion-dollar events.
It is important to keep in mind that these estimates do not reflect the total cost of U.S. weather and climate disasters, only those associated with events more than $1 billion in damages. That means they are a conservative estimate of how much extreme weather costs the United States each year. However, these billion-dollar events do account for most of the damage from all recorded U.S. weather and climate events (NCEI; Munich Re), and they are becoming an increasingly larger percentage of the total damage costs from weather-related events at all scales and loss levels.
The U.S. losses from billion-dollar disasters over the last seven years (2017-2023) are more than $1 trillion and have further skewed the total distribution of extreme weather costs. From 1980-2000, about 75% of all disaster-related costs were due to billion-dollar disasters, and by 2010, the percentage had risen to about 80%. By 2023, it has risen to >85% of all disaster-related costs, or $2.660 trillion out of $3.050 trillion.
Increasing trend of high-cost disasters: exposure, vulnerability, and climate change
The number and cost of weather and climate disasters are increasing in the United States due to a combination of increased exposure (i.e., more assets at risk), vulnerability (i.e., how much damage a hazard of given intensity—wind speed, or flood depth, for example—causes at a location), and the fact that climate change is increasing the frequency of some types of extremes that lead to billion-dollar disasters (Fifth U.S. National Climate Assessment (2023).
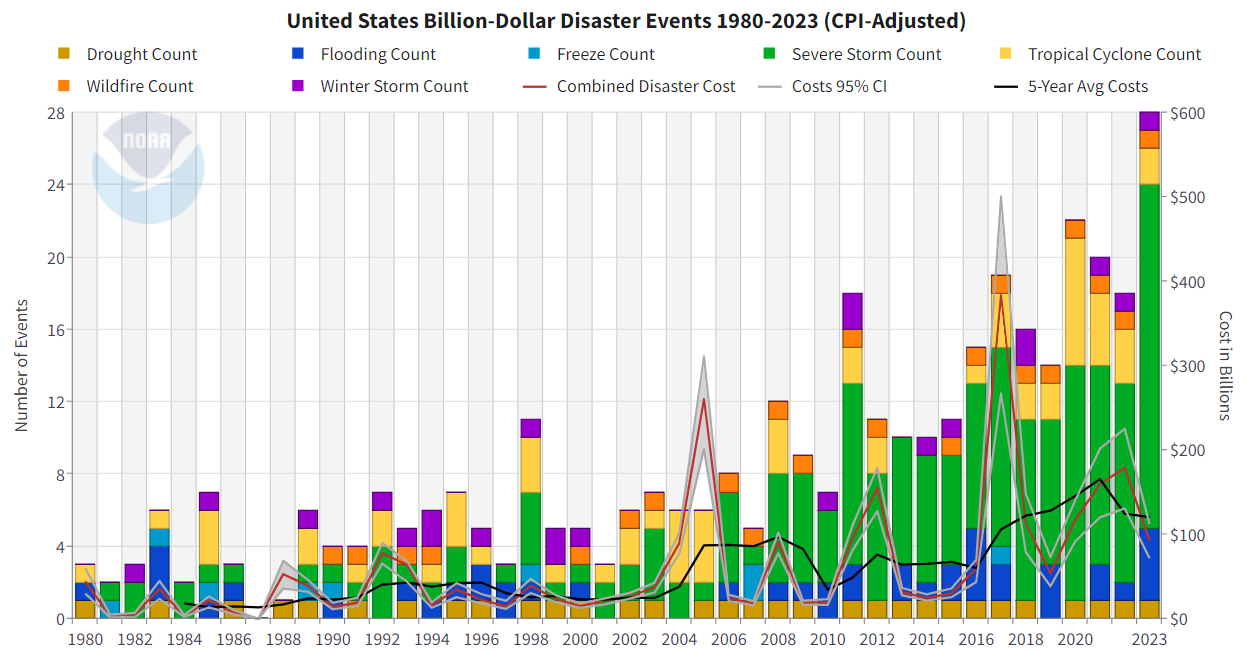
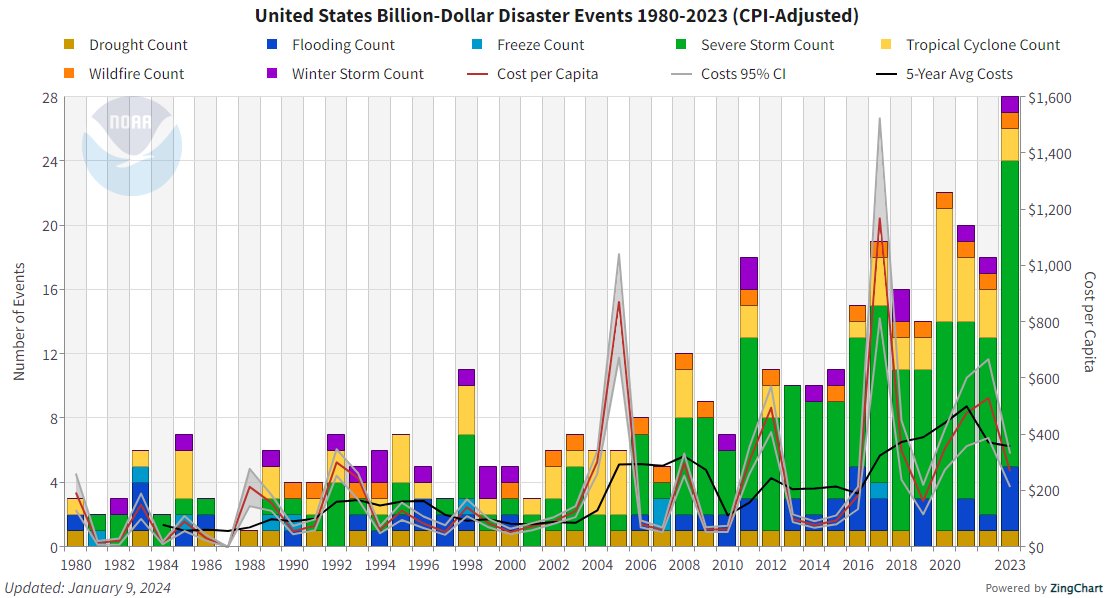
The history of billion-dollar disasters in the United States each year from 1980 to 2023, showing event type (colors), frequency (left-hand vertical axis), and cost (right-hand vertical axis.) The number and cost of weather and climate disasters is rising due to a combination of population growth and development along with the influence of human-caused climate change on some type of extreme events that lead to billion-dollar disasters. NOAA NCEI.
In other words, the increase in population and material wealth over the last several decades are an important cause for the rising costs. These trends are further complicated by the fact that much of the growth has taken place in vulnerable areas like coasts, the wildland-urban interface, and river floodplains. Vulnerability is especially high where building codes are insufficient for reducing damage from extreme events. This is part of the reason that the 2010s decade is far costlier than the 2000s, 1990s, or 1980s (all inflation adjusted to 2023 dollars).
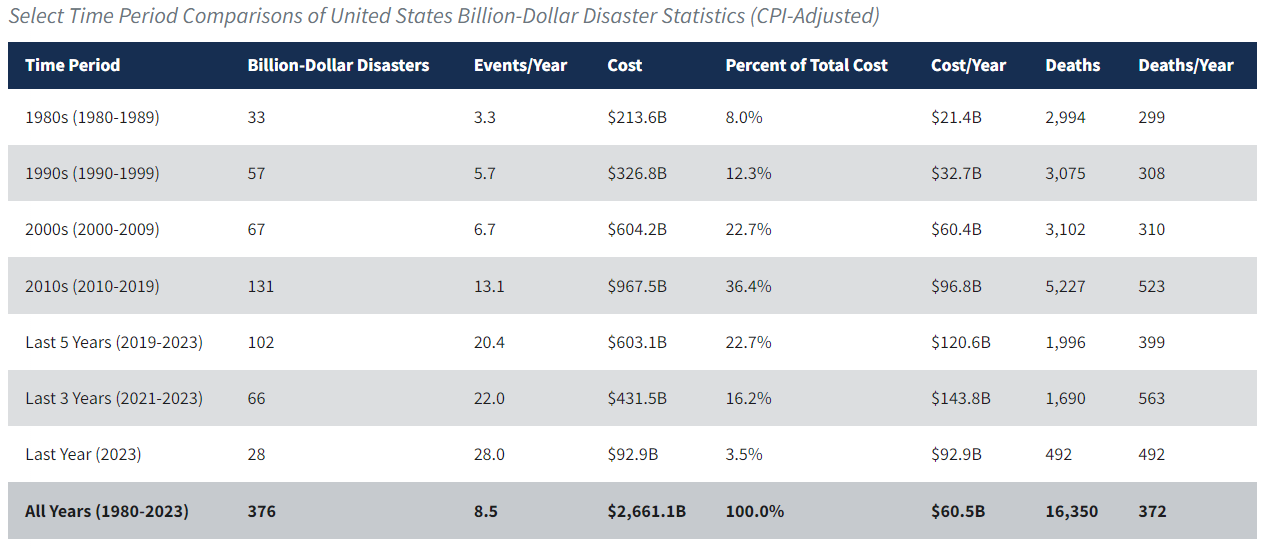
Screenshot of a table of summary statistics of billion-dollar disasters by decade and by latest 1, 3-, and 5-year periods. NCEI Billion-dollar disaster web interface.
The cost per capita (see right y-axis in chart below) is also rising for the U.S. as a whole meaning that the costs of the billion-dollar disasters is rising more sharply than general population growth. The chart shows the 5-year-average disaster cost per capita was about $150 (inflation-adjusted) per U.S. resident in the early-2000’s. The 5-year average disaster cost per capita then increased above $400 per person in the late 2010’s and has remained at a high level in recent years. The cost per capita data can also be examined at state and regional level for more detail.
We also know from research using other kinds of climate and weather data that climate change is supercharging the increasing frequency and intensity of certain types of extreme weather that lead to billion-dollar disasters—most notably the rise in vulnerability to drought, lengthening wildfire seasons in the Western states, and the potential for extremely heavy rainfall becoming more common in the eastern states. Sea level rise is worsening hurricane storm surge flooding. (Read more about changes in climate and weather extremes in the Fifth U.S. National Climate Assessment (2023). Given those trends, it’s likely that human-caused climate change is having an influence on the rising costs of billion-dollar disasters.
Given all these compounding hazard risks, there is an increased need to focus on where we build, how we build, and investing in infrastructure updates that are designed for a 21st-century climate.
Notable U.S. billion-dollar disasters of 2023
Among the many weather and climate-related disasters to affect the U.S. in 2023, the following caused the most damaging impacts and heavily impacted many communities:
Southern / Midwestern Drought and Heat Wave: 247 deaths, $14.5 billion
Drought conditions impacted numerous Southern and Midwestern states. The agriculture sector in this particular area was also impacted, including damage to field crops from lack of rainfall and heat. Ranchers were forced to sell-off livestock early in some regions due to high feeding costs.
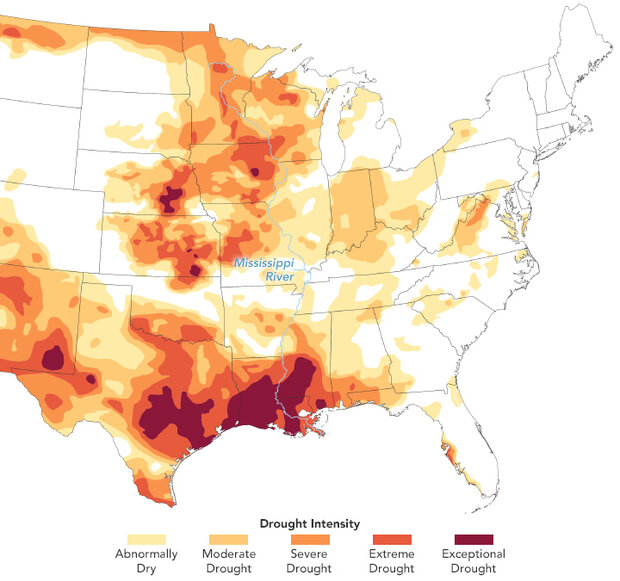
Drought conditions along the Mississippi River as of September 26, 2023. All 10 states the river borders or passes through had areas of at least abnormal dryness (yellow); 8 of the 10 were in some level of drought (orange to red). NASA Earth Observatory image, based on data from the U.S. Drought Monitor project.
For the second straight year, portions of the Mississippi River experienced record-low water levels impacting river commerce. This also allowed salt water from the Gulf of Mexico to migrate northward, along the bottom of the Mississippi River, impacting water quality in southern Louisiana.
Central Tornado Outbreak and Eastern Severe Weather in early March 31-April 1: 33 deaths, $5.7 billion
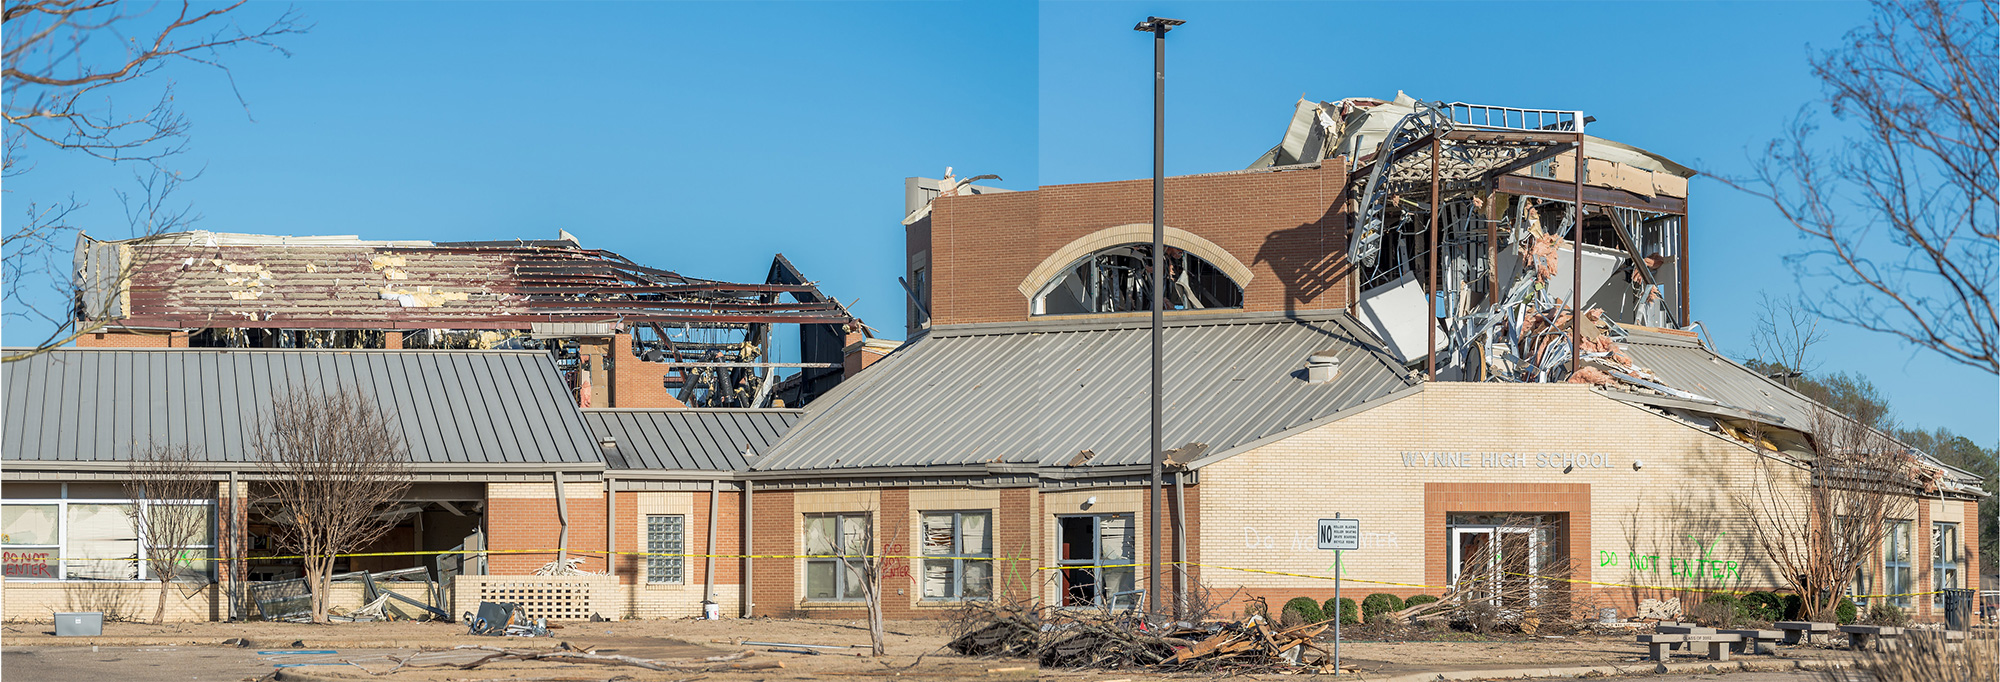
Tornado damage to multiple structures at the high school in Wynne, Arkansas, following a tornado on March 31, 2023. Panoramic photo mosaic using 2 photos from the Arkansas Tornado 2023 Flickr album of insurance company State Farm. Used under a Creative Commons license.
A destructive tornado outbreak on March 31 produced over 150 preliminary tornadoes across many southern and central states. This was the largest outbreak in a 24-hour period for the month of March. The surveyed tornado ratings so far include: 41 EF-0, 41 EF-1, 33 EF-2, 11 EF-3, and 1 EF-4 tornado. The strongest tornado from this event occurred in Keota, Iowa and was rated an EF-4 with maximum wind speeds of 170 mph (274 kph). Damage surveys pinpointed significant damage in parts of western Little Rock, Arkansas as an EF-3 injured 54 and led to one fatality in Pulaski County. Another EF-3 tornado injured 26 near Wayne, Tennessee while an EF-3 tornado near Covington, Tennessee injured 28 and led to four fatalities. In addition, large hail and damaging winds spread a swath of damage from Texas to Ohio impacting homes, vehicles, businesses, government buildings and infrastructure. In total, there were more than 20 fatalities and more than 200 injuries reported during this tornado outbreak.
Hawaii firestorm, August 8: 100 deaths, $5.6 billion
In the contiguous U.S., the 2023 Western wildfire season was below average, but Canada and the island of Maui in Hawaii suffered unprecedented wildfire impacts and damage. On Maui, the deadliest wildfire in the U.S. in over a century devastated the historic town of Lahaina. Winds from Hurricane Dora exacerbated the wildfire as it rapidly spread, destroying thousands of homes, vehicles and businesses in its path.
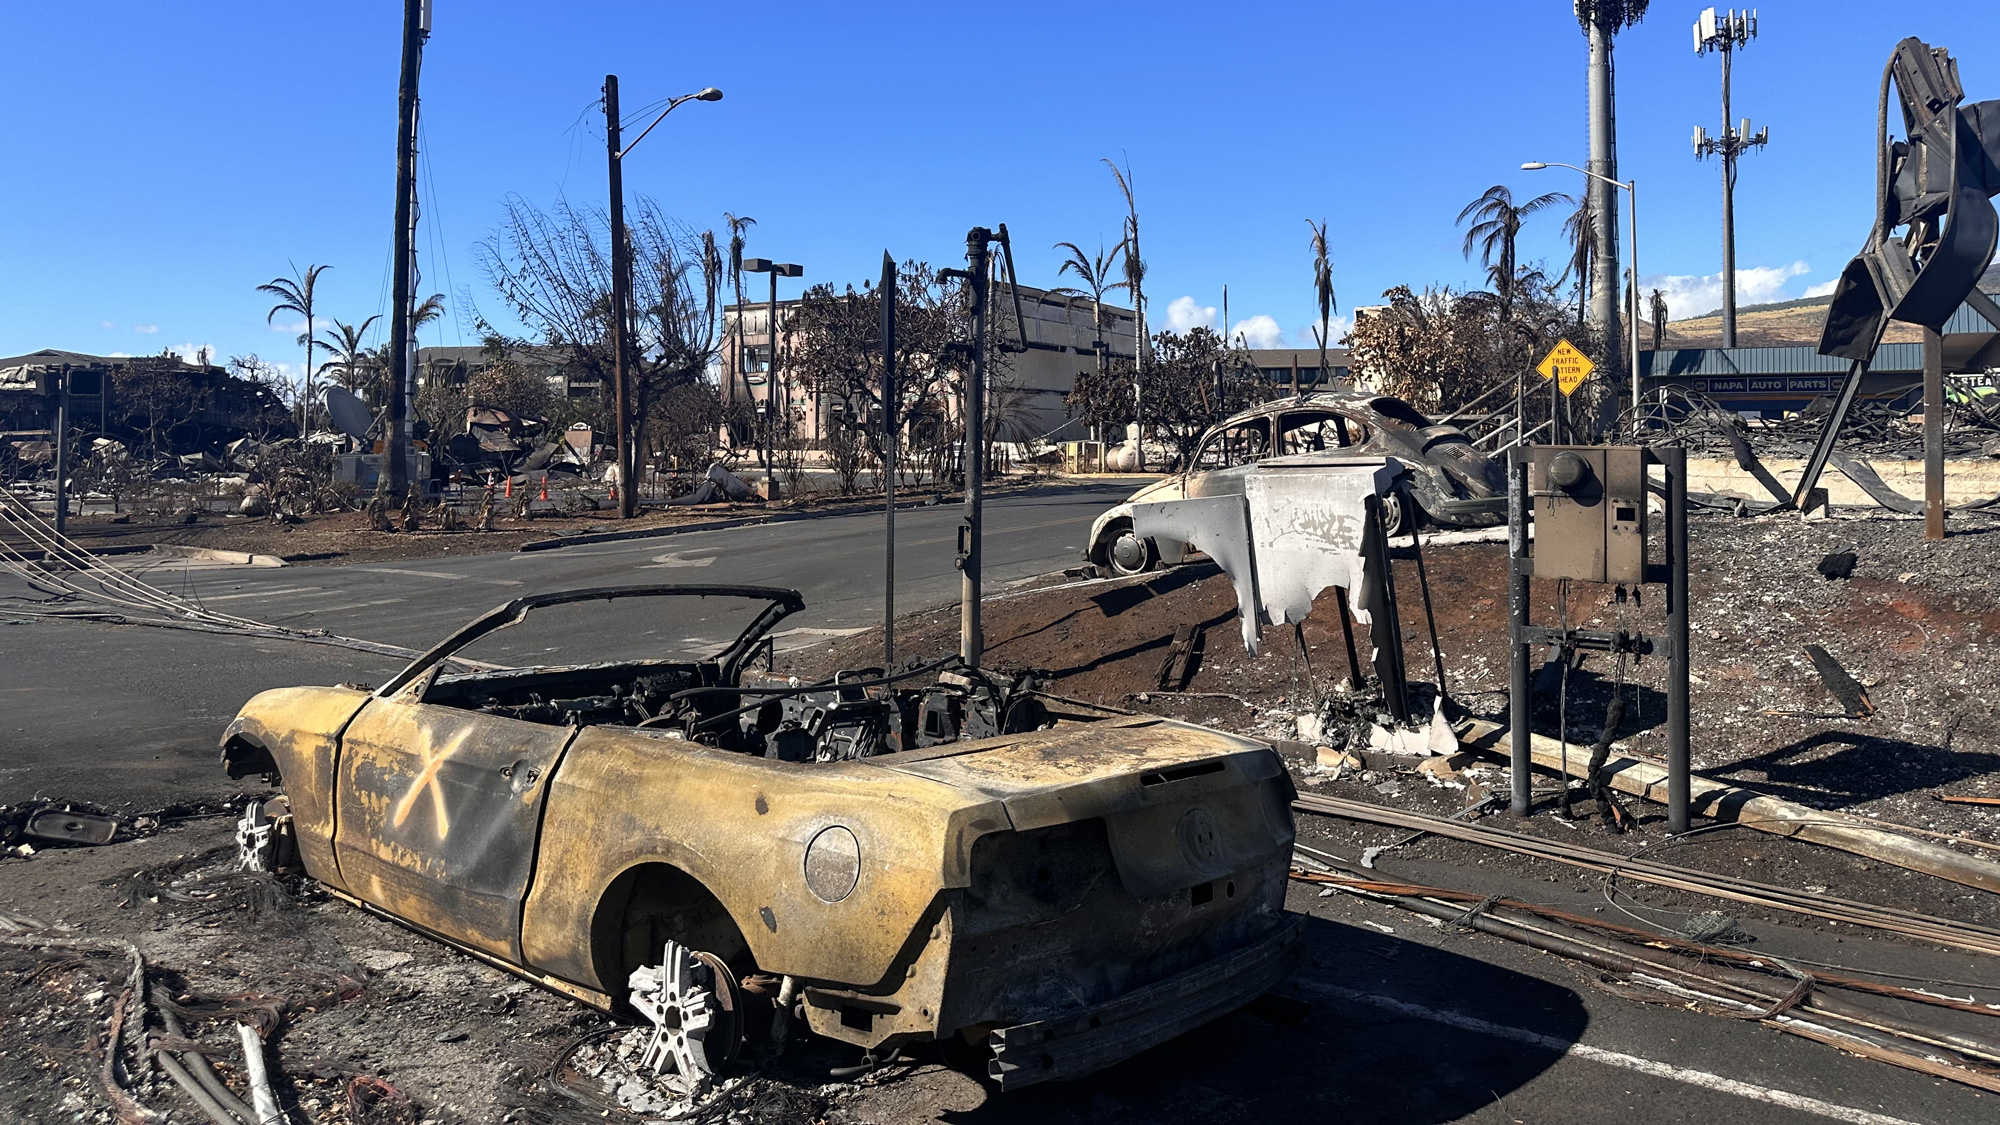
Burned cars, signs, and other structures in Lahaina, on Maui Island, following a deadly fire on August 8, 2023. The X means the car in the foreground was searched and cleared. Photo cropped from original in the State Farm Flickr album 2023 Maui Wildfires. Used under a Creative Commons license.
1980-2023 costs and fatalities by disaster type
The distribution of damage from U.S. billion-dollar disaster events from 1980 to 2023 is dominated by tropical cyclone losses. Tropical cyclones have caused the most damage ($1,379.3 billion) and have the highest average event cost ($22.2 billion per event). Severe storms ($455.2 billion), drought ($352.9 billion),and inland flooding ($196.6 billion) have also caused considerable damage based on the list of billion-dollar events.
Severe storms have caused the highest number of billion-dollar disaster events (186), but they have the lowest average event cost ($2.4 billion), not surprising given their localized nature. Tropical cyclones and flooding represent the second and third most frequent event types (62 and 44), respectively. Tropical cyclones are responsible for the highest number of deaths (6,897), followed by drought/heatwave events (4,522) and severe storms (2,094).
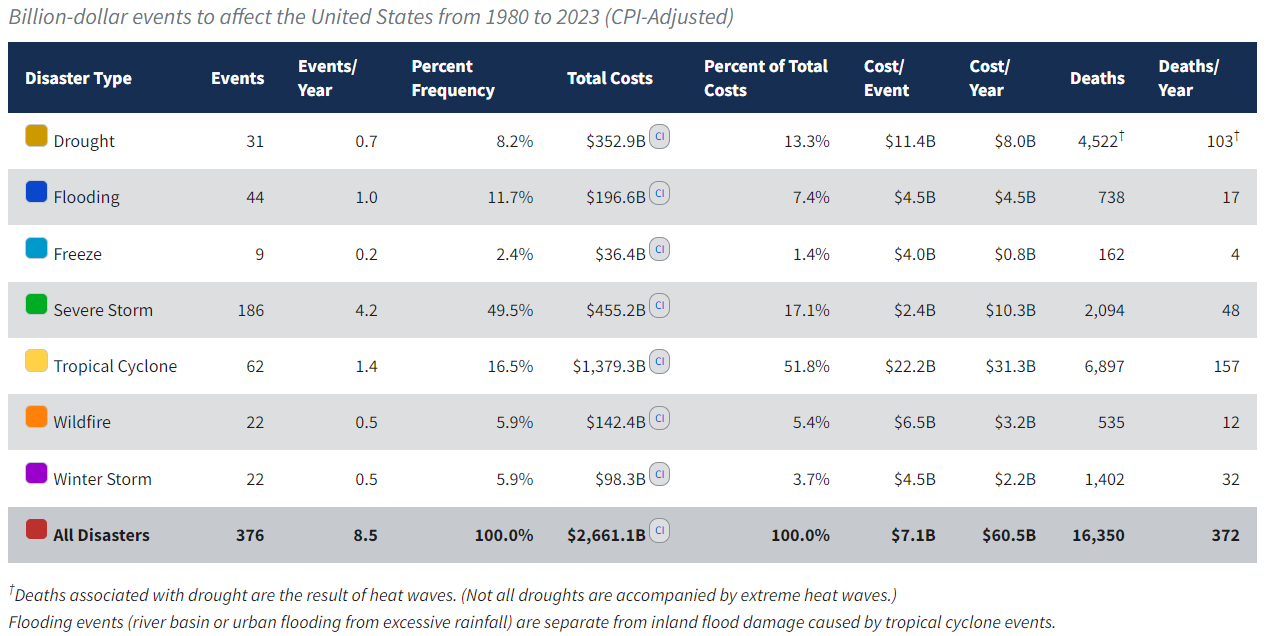
This table shows the breakdown, by hazard type, of the 376 billion-dollar weather and climate disasters assessed since 1980. Screenshot from the NOAA NCEI Billion-dollar Disasters webpage.
In 2016-2018, the U.S. was impacted by 6 separate billion-dollar hurricanes (i.e., Matthew, Harvey, Irma, Maria, Florence, Michael) with 3,318 fatalities and an inflation-adjusted loss total of $400.8 billion. As a comparison, the U.S. also experienced a series of active hurricane seasons from 2003-2005 where 9 separate billion-dollar hurricanes (including Katrina, Rita, and Wilma in 2005) made landfall, with 2,225 fatalities and an inflation-adjusted loss total of $352.9 billion.
Climatology of billion-dollar disasters
Disasters by region
The South, Central and Southeast regions of the United States, including the Caribbean U.S. territories, have suffered the highest cumulative damage costs, reflecting the severity and widespread vulnerability of those regions to a variety of weather and climate events.
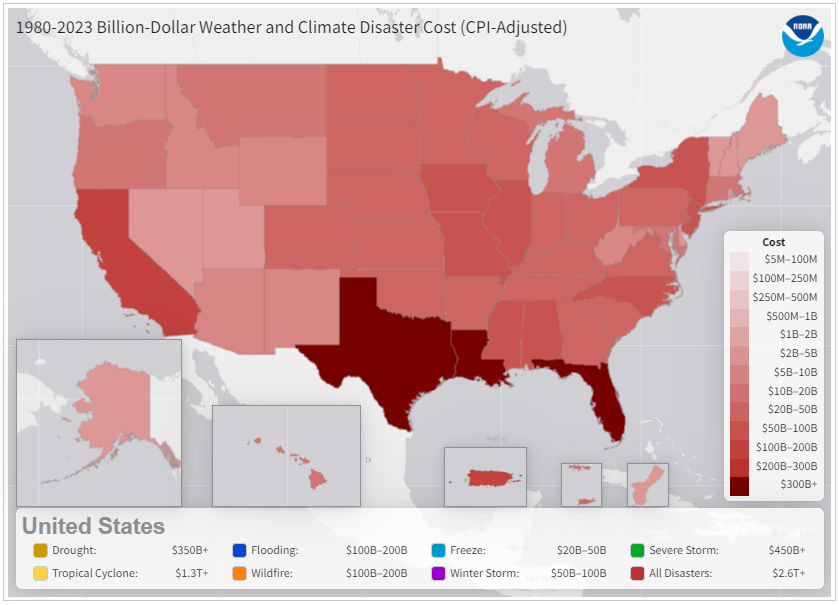
This map depicts the total estimated cost borne by each state from billion-dollar weather and climate events from 1980-2023. Screenshot from NOAA NCEI Billion-dollar Disasters web mapping tool.
In addition to the highest number of billion-dollar disasters experienced, Texas also leads the U.S. in total cumulative costs (~$402 billion) from billion-dollar disasters since 1980. Florida is the second-leading state in total costs since 1980 (~$389 billion), largely the result of destructive hurricane impacts. Louisiana’s total costs are the 3rd highest (~$304 billion) from billion-dollar disasters.
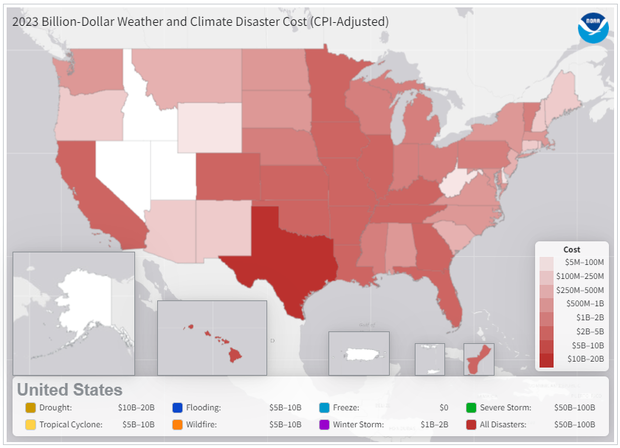
Screenshot of a map the US showing the billion-dollar disasters cost per 1 million residents for each state during 2023. NOAA NCEI image from the Billion-dollar Disaster web mapping tool.
The map above shows how the impact of the 2023 Southern and Central Drought combined with the many severe storm events caused more than one dozen states to have $2-5 billion in damage costs EACH. The costliest hazard overall was severe storm events with $54.0 billion in damage. Dozens of states across the nation sustained relatively high levels of damage from hail, derechos and tornadoes. Four separate billion-dollar flood events also were impactful across California, Florida and the Northeast.
Billion-dollar disasters by month
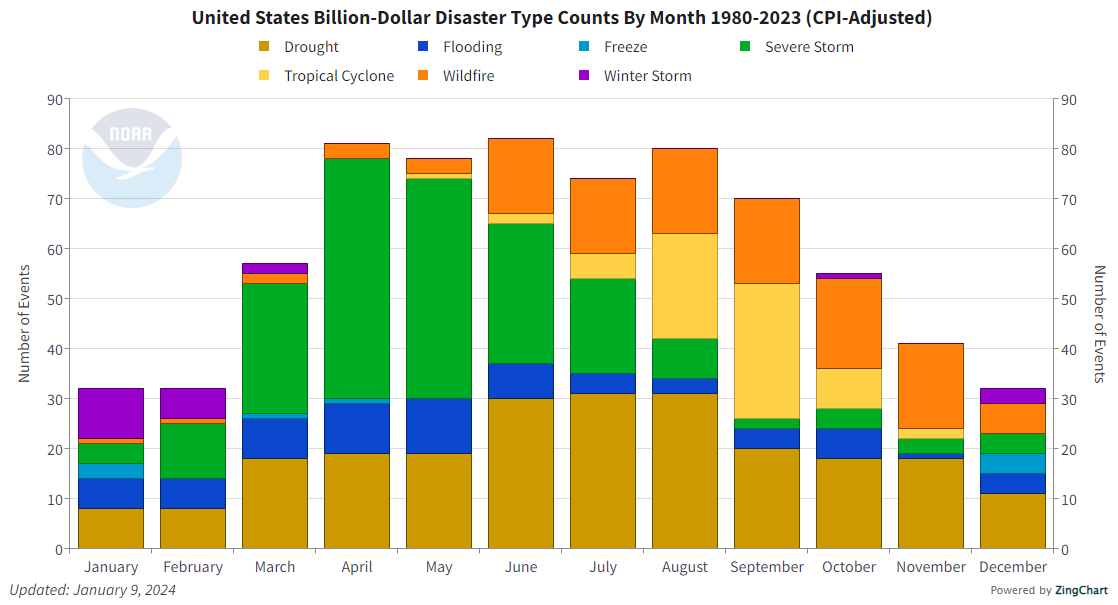
The monthly climatology of U.S. billion-dollar weather and climate disasters from 1980 to 2023, showing which months have the greater frequency of disasters (height of bar) and which types of events (colors) are most likely to occur in a given month. NOAA NCEI image.
The 44-year climatology of U.S. billion-dollar disasters offers a view of risk from extreme events, which are often seasonal in nature. For example, during the spring months (March-May) severe storms (green blocks), including tornadoes, hail, and high winds, often occur in many Central and Southeast states, but they taper off in the second half of the year. During the spring months there is also greater potential for major river flooding (i.e., deep blue events in chart above). U.S. springtime flooding from snowmelt and/or heavy rainfall is a persistent hazard that affects many towns and agriculture regions within the Missouri and Mississippi River basins, among others. During the fall season, Gulf and Atlantic coast states must be vigilant about hurricane season particularly during August and September (i.e., yellow events in chart above).
Also, the peak of the Western U.S. wildfire season occurs during the fall months of September, October and November (i.e., orange events in chart above). California, Oregon, Washington, Idaho, Montana and Colorado often experience enhanced wildfire risk and related poor air quality for weeks to months. Western wildfire risk is also becoming more hazardous, as 17 of the 20 largest California wildfires by acreage and 18 of the 20 most destructive wildfires by number of buildings destroyed have occurred since the year 2000. In four of the last seven years (2017, 2018, 2020 and 2021), California has experienced historically large and costly wildfires, with losses well exceeding $70.0 billion.
In total, each region of the U.S. faces a unique combination of recurring hazards, as billion-dollar disaster events have affected every state since 1980. The chart above highlights how the frequency of billion-dollar disasters differs across both time and space. The combined historical risk of U.S. severe storms and river flooding events places the spring and summer seasons in the high-risk category for simultaneous extreme weather and climate events, while hurricanes, wildfires and drought dominate the fall season.
Compound extremes
The increase in disasters creates 'compound extremes' (e.g., billion-dollar disaster events that occur at the same time or in sequence), which are also an increasing problem for recovery. As noted in the recent Fifth National Climate Assessment (2023), "climate change is also increasing the risk of multiple extremes occurring simultaneously in different locations that are connected by complex human and natural systems. For instance, simultaneous megafires across multiple western states and record back-to-back Atlantic hurricanes in 2020 caused unprecedented demand on federal emergency response resources."
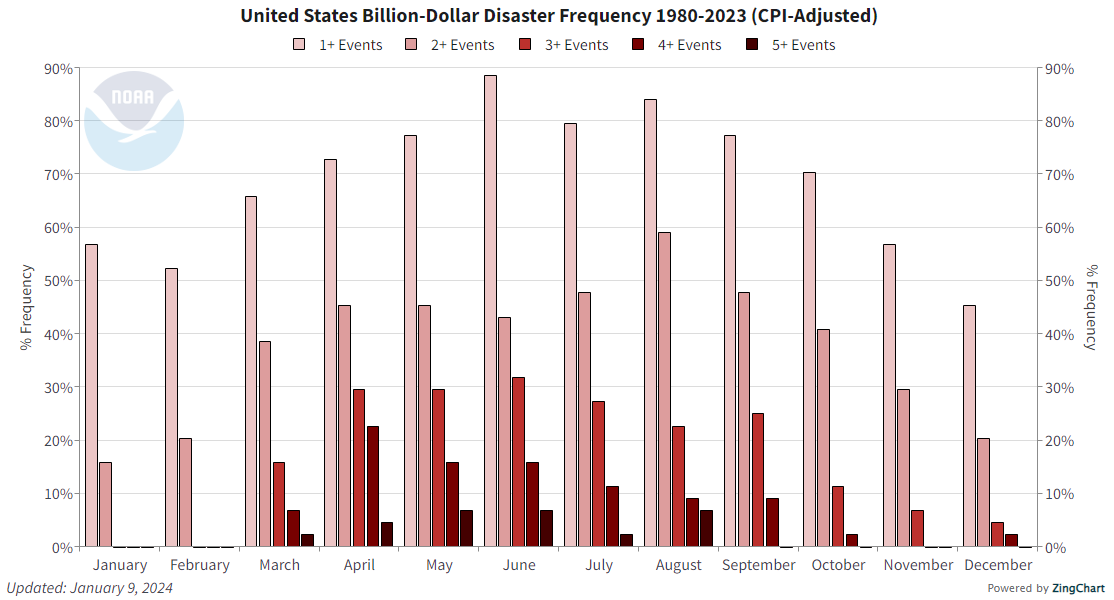
This graph shows the percent frequency of a given month having at least one billion-dollar disaster (light pink bars), 2 or more events (medium pink bars), 3 or more (red), 4 or more (darker red), or 5 or more (darkest red). Billion-dollar weather and climate disasters occur in all months, but the spring and summer (March–Aug) are the time when multiple, concurrent disasters are likely. A second maximum occurs in the Fall driving by tropical cyclones. Screenshot from the NCEI Billion-dollar Disasters webpage.
Other examples include multiple hurricane landfalls (Hurricanes Ian and Nicole) in Florida within a span of several weeks in 2022. And most recently, in 2023, when Central states were impacted by back-to-back severe storm outbreaks compounding the disaster recovery process.
Over the last six years (2018-2022), there were just 18 days on average between billion-dollar disasters compared to 82 days in the 1980s. Shorter time intervals between disasters often mean less time and resources available to respond, recover and prepare for future events. This increased frequency of events produces cascading impacts that are particularly challenging for vulnerable socioeconomic populations.
Explore the billion-dollar disasters database from NOAA National Centers for Environmental Information.
Comments
Figure 5 is duplicate of Figure 4
The figure which is supposed to be per capita cost is a repeat of figure 4, billion dollar disaster count.
Duplicate figure
It looks similar, but note the second Y-axis values (right side of figure).
Add new comment