August 2022 ENSO update: Summer Nights
La Niña continues! It’s likely that the La Niña three-peat will happen: the chance that the current La Niña will last through early winter is over 70%. If it happens, this will be only the third time with three La Niña winters in a row in our 73-year record. ENSO (El Niño/Southern Oscillation, the whole La Niña and El Niño system) has the greatest influence on weather and climate during the Northern Hemisphere cold season, so forecasters pay especially close attention when it looks like ENSO will be active in the winter.
Hopelessly Devoted to You
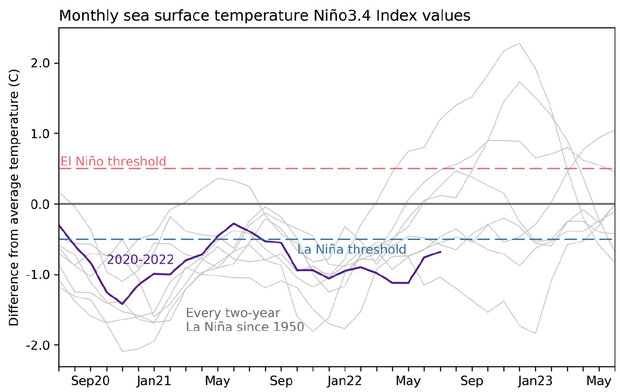
La Niña is present when the sea surface temperature in the east-central Pacific Ocean is at least 0.5 °C (0.9 °F) cooler than the long-term average, along with evidence of a stronger atmospheric circulation above the equatorial Pacific. In July, the sea surface temperature in the Niño-3.4 region of the tropical Pacific, our primary monitoring region, was 0.7 °C cooler than average (average = 1991–2020) according to the ERSSTv5 dataset. This makes 21 of the past 24 months with a deviation from average below -0.5 °C.
Three-year history of sea surface temperatures in the Niño-3.4 region of the tropical Pacific for the 8 existing double-dip La Niña events (gray lines) and the current event (purple line). Of all the previous 7 events, 2 went on to La Niña in their third year (below the blue dashed line), 2 went on to be at or near El Niño levels (above the red dashed line) and three were neutral. Graph is based on monthly Niño-3.4 index data from CPC using ERSSTv5. Created by Michelle L’Heureux.
We Go Together
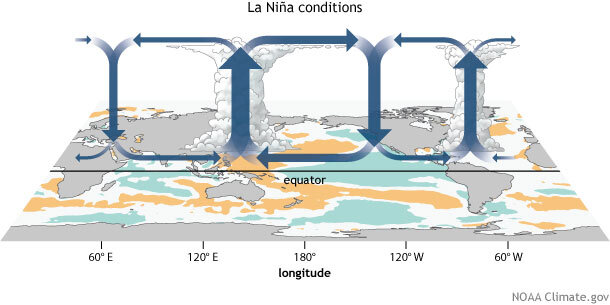
The average circulation of the atmosphere over the tropical Pacific—called the Walker circulation—makes a giant loop: rain and rising air over the very warm waters of the far western Pacific and Indonesia, west-to-east winds at high altitudes, descending air and drier conditions over the relatively cooler central/eastern Pacific, and the east-to-west trade winds near the surface. La Niña’s cooler-than-average central/eastern Pacific acts to strengthen this circulation, with more rain than average over Indonesia, less rain over the central tropical Pacific, and stronger upper-level and lower-level winds. In turn, those stronger low-level trade winds cool the surface further, and help to keep warm water piled up in the far western Pacific.
Generalized Walker Circulation (December-February) anomaly during La Niña events, overlaid on map of average sea surface temperature anomalies. Anomalous ocean cooling (blue-green) in the central and eastern Pacific Ocean and warming over the western Pacific Ocean enhance the rising branch of the Walker circulation over the Maritime Continent and the sinking branch over the eastern Pacific Ocean. Enhanced rising motion is also observed over northern South America, while anomalous sinking motion is found over eastern Africa. NOAA Climate.gov drawing by Fiona Martin.
July recorded all the expected strengthened Walker circulation features, including substantially stronger-than-average trade winds. The trade winds led to the cooler-than-average surface temperature strengthening over the month, a tendency we can see in the weekly measurements, which started July at -0.5 °C and ended at -1.0 °C. While the weekly anomaly is useful for monitoring current conditions, ENSO is a seasonal phenomenon, so conditions must remain for several months to qualify, and to affect global weather patterns. Michelle gets into this in more detail in her internet-ancient—but still entirely relevant—post.
Rock ‘n Roll Is Here to Stay
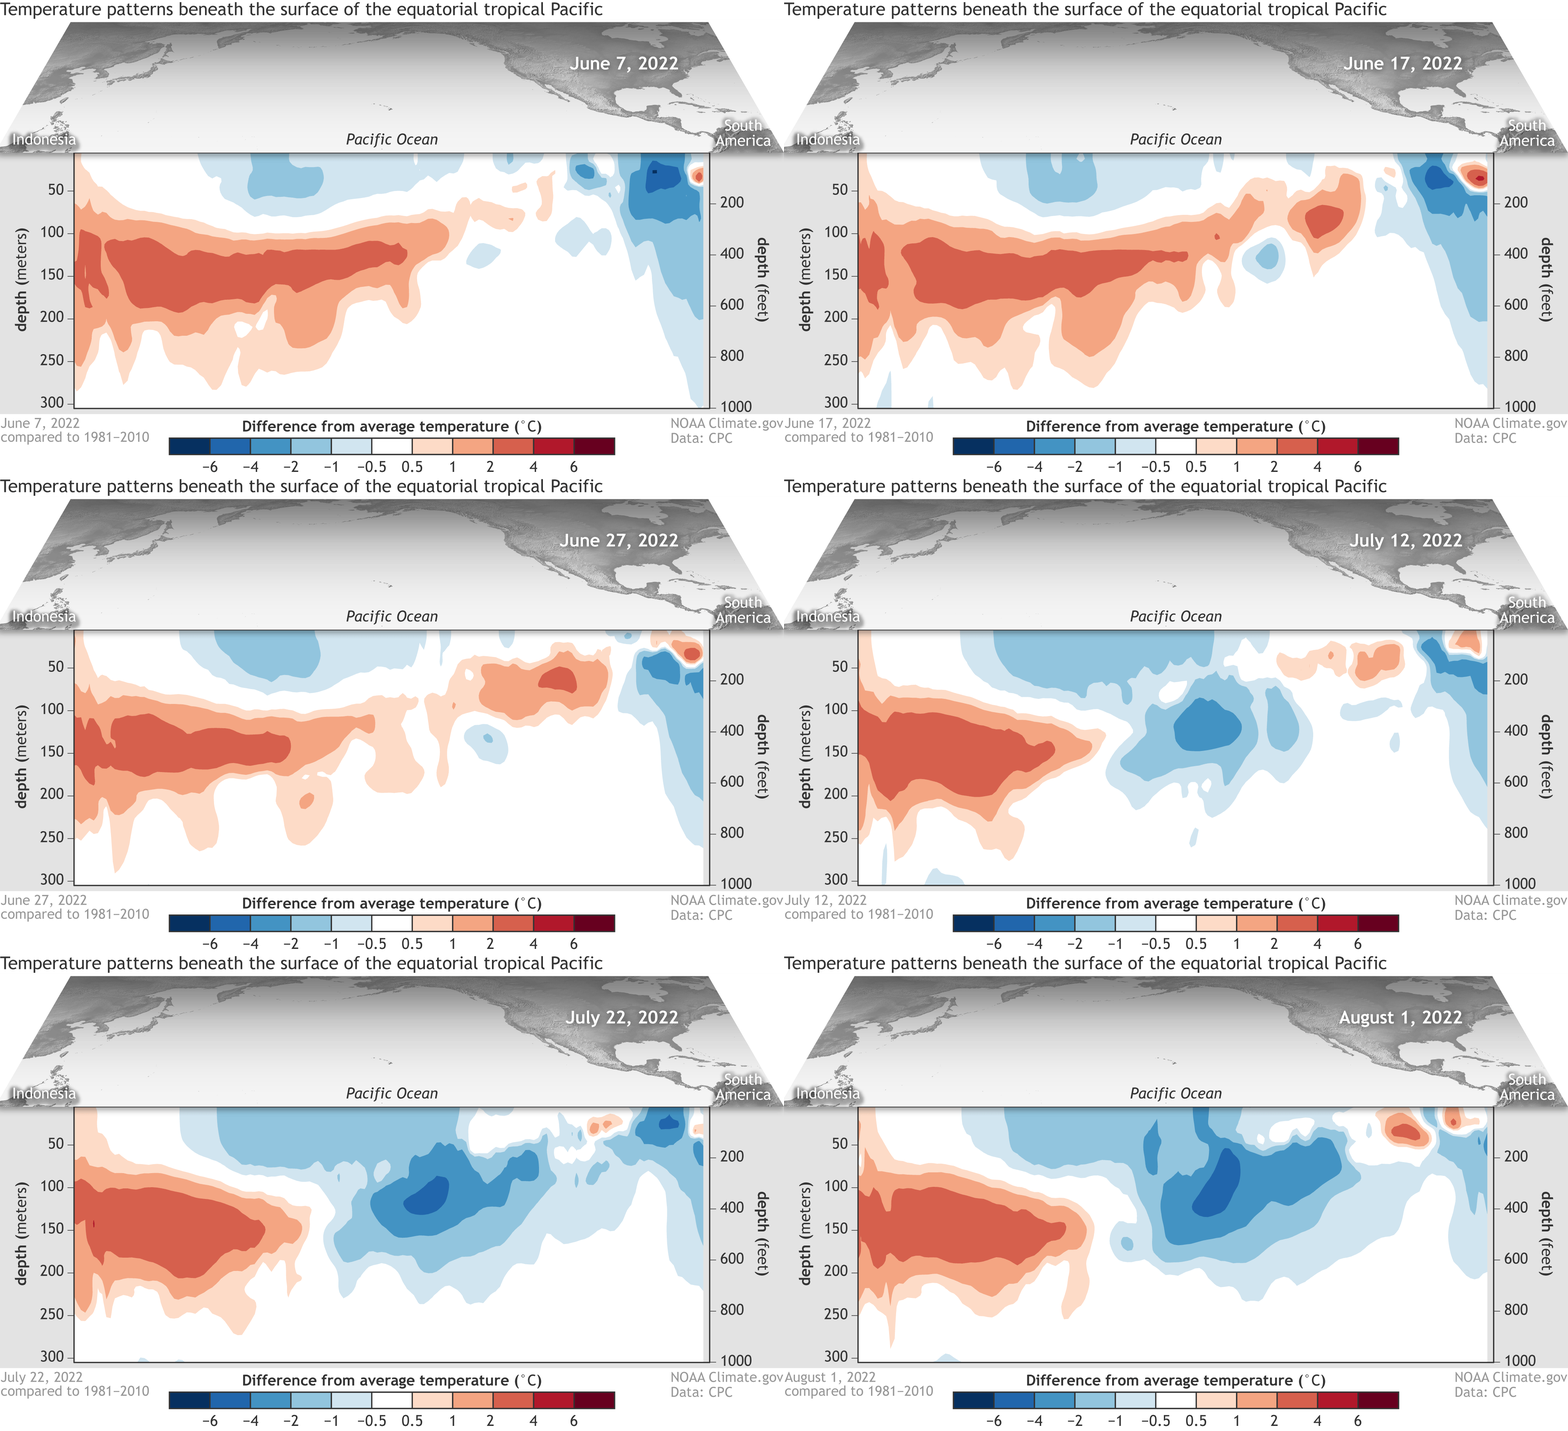
Another outcome of the stronger trade winds during July was the development of an upwelling Kelvin wave, cooler-than-average water that travels west-to-east under the surface of the equatorial Pacific. As the trade winds drag the surface waters westward, cooler water is drawn up from the deeper ocean.
Difference from average temperature in the top 300 meters (~984 feet) of the tropical Pacific between June 7 and August 1, 2022. A deep pool of cooler-than-average water (blue) spread eastward and will continue rising to the surface in coming months, feeding the current La Niña. Animation by NOAA Climate.gov, based on data from NOAA Climate Prediction Center.
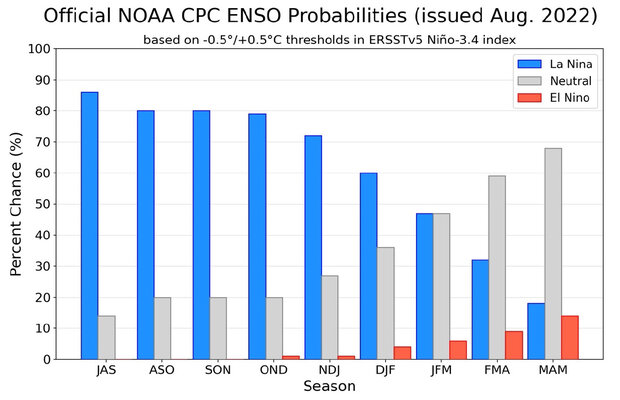
This upwelling Kelvin wave will provide a source of cooler water to the surface over the next couple of months, which in turn provides increased confidence to the short-term La Niña forecast. With most of our computer models predicting La Niña will last into the winter, forecaster probabilities are fairly confident through December–February.
NOAA Climate Prediction Center forecast for each of the three possible ENSO categories for the next 8 overlapping 3-month seasons. Blue bars show the chances of La Niña, gray bars the chances for neutral, and red bars the chances for El Niño. Graph by Michelle L'Heureux.
Several models are predicting that La Niña will transition to neutral in January–March, and the forecast team provides even chances (47%) for either outcome (La Niña or neutral). It would be pretty rare for the event to terminate so early in the year. If La Niña does decay to neutral in January–March 2023, it would be only the 4th time in the 24 La Niña winters we have on record.
Greased Lightning
As I mentioned up above, La Niña’s greatest influence on weather and climate is during the winter. Also, of course, La Niña can be conducive to an active Atlantic hurricane season, something reflected in NOAA’s recent update to the outlook.
During summer, local processes are more important for determining weather patterns, including the North American Monsoon. This year, the Monsoon has contributed to some devastating floods, but also provided much-needed rain for the drought-stricken Southwest. I checked in with our consultants for the North American Monsoon post, Zack Guido and Mike Crimmins. They have an excellent podcast with tons of fascinating detail about the Monsoon, so check it out if your interest is piqued!
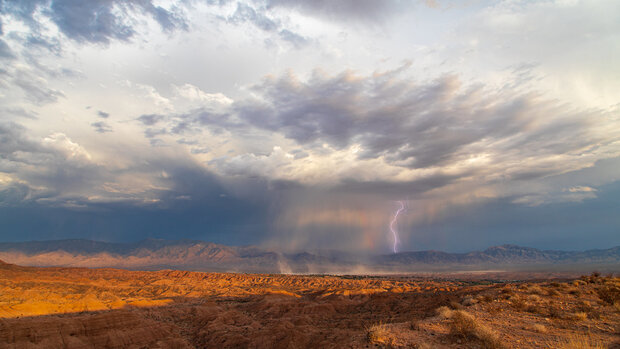
Rain and lightning over desert hills near Mesquite, Nevada, on August 30, 2021, during the summer monsoon. Photo by Flickr user John Getchel. Used under a Creative Commons license.
Mike had this to say about this year’s Monsoon:
We just crossed through the typical middle of the season (early August), and the first half was really good for just about all of the Southwest. Over 80% of Arizona and New Mexico are observing near-average or better rainfall so far this season, and more than half of the region at above-average or better! The whole season started with some epic rains over New Mexico that helped end their record fire season, and the moisture and storms have kept coming ever since.
This year has been interesting and different from last year’s very wet monsoon. Last year we had great monsoon moisture and two unusual large upper-level low pressure systems bring several days of widespread rain in July and August of last year. We haven’t really had anything big like that this year, just sustained deep moisture and the occasional wiggle in the upper-level flow to help organize precipitation into lines of storms from time to time. It has felt a bit more like a solid, active season that hasn’t needed any special tricks to stack up the precipitation totals across the region.
The relationship between La Niña and the Monsoon is not strong , but I asked Mike if he could speculate a little. He had this to say:
I am not sure of the influence of La Niña this year, but it certainly could be there. Some research on ENSO and the monsoon suggest that La Nña is correlated with an early start to the season in Arizona and New Mexico and wetter-than-average conditions through July. The signal then decays through August. This season follows that pattern, but I’m not sure of the causal links.
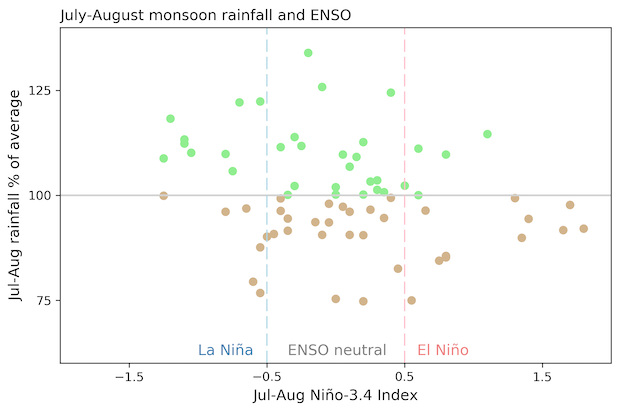
July–August rainfall anomaly averaged over North American Monsoon region for every year 1950–2019 (y-axis) versus Niño-3.4 index (x-axis). Wetter-than-average monsoons (green dots) are slightly more common during La Niña years, while drier-than-average monsoons (brown dots) are slightly more common during El Niño years. Monsoon region averaged over all land gridpoints, 20°N–37°N, 102°W–115°W. Data from Global Precipitation Climatology Centre (GPCC) and ERSSTv5. Figure by Emily Becker.
You’re the One That I Want
The Monsoon has helped with the Southwest drought, something Tom discusses in his recent coverage of the August climate outlook. However, La Niña often contributes to dry winters through the West, so we’re far from out of the woods, drought-wise. Stay tuned here—we’ll keep you up to date on all things ENSO.
Comments
La Nina
We are rooting for that January/February decay which all the models seem to be suggesting. Since we will be stuck with a La Nina during the first half of winter, we are hoping the SSTs in the Nino 3 and Nino 1.2 regions rapidly heat up and cold pool stays out west.
Agreed!
Agreed!
Excellent coverage
Thank you for the excellent description of these weather phenomena, and their relationships and impacts! The recent rains made a dent into the drought, but that's very limited to the near-surface, the deeper groundwater remains severely stressed through the US Southwest. The looming third La Nina repeat does not bode well for water availability into 2023.
https://nasagrace.unl.edu/
It will certainly take more…
It will certainly take more than the recent Monsoon rains to break the drought. Thanks for the comment.
Temperature of seawater is dangerously higher in Europ !
I think we can expect more heavy storms in Europ starting November and further; also due to the much higher above normal temperatures (+3° C) North Atlantic & Mediterranean Sea even (+4 to 5° C)... What do you think please ? Thank You
ON-J Tribute
I'm sure our friend's with the Australia BoM appreaciate the Olivia Newton-Johmn theme of the article : ) and hoping for a less-than average Atlantic season.
This was "Magic"
Well done on the Olivia Newton John Tribute throughout the article
Next year
Just curious as to the conditions of the year that followed the first two La Nina three-petes?
Third-year La Nina
You can check, for example, this blog post to see US maps for the winters of 1975-76 and 2000-01. You can see notable differences between the two winters - for example, 1975-76 was warmer than average whereas 2000-01 was cooler than average over the US. We also see big differences in the precipitation over the Pacific Northwest (1975-76 wet, 2000-01 dry). The bottom line is that chaotic weather variability likely factored into those winters, as with all winters, and there's no clear signal for anything distinct from the typical La Nina influences.
If you would like to check out other variables, seasons, or regions, I recommend using this site to construct your own maps.
ENSO historic records
Hi Emiley and everyone,
I have few questions please : why don't we have ENSO records dating to years before 73 years . any explanation/reason .
Can we rely on reconstructed thermal records / or have anyone used reconstructed thermal records and other parameters to predict past ENSO states for at least the last 600 years . i appreciate your help.
Finally, the current tripple dipped laninas have followed nearly similar pattern to that occurred during 1974-1975 with great similarity ( not identical but similar in general ). I realize it is not sufficient data to extrapolate information based on one or two seasons , but have you kindly checked the pattern ( evolution of summer and autumn 1975 and winter then the advent into winter 1976) on global scale , the patterns of thermal anomalies show striking similarity . have you kindly tried to re-analyze the years 1975-1976 more indepth and contrast with 2022-2021 . I realize also other climatic factors are into play and surprises might happen .
Warmest regards
Mohamad Alkhateeb
SST data
Hi Mohammad, I will attempt to answer your questions. Regarding the length of the ENSO record, we focus on the period after 1950 because this is the period when we have the most reliable observations. We do have sea surface temperature data before 1950, primarily by ships of opportunity, and we do have datasets that use statistical methods to fill the data gaps and reconstruct the temperature data much farther back, generally to the late 1800s. So, we can (and do) analyze ENSO events before 1950 with these datasets, but there is considerably more uncertainty in the data. If you check out Fig. 3 of this paper, you can get an idea of how sea surface temperature data coverage has changed with time.
You're right that we also can reconstruct ENSO records much farther back using various types of paleoclimate proxy records such as tree rings and corals. Guest author Dr. Kim Cobb wrote about this topic in this post. I actually was part of a study that used tree ring data to reconstruct ENSO data back 700 years (found here). Of course, it's important to realize that data uncertainties are even higher for these data than for the historical period.
Regarding any comparisons to 1974-75, I am not aware of any detailed comparison that has been done (I have not yet done it). Seeing some similarities would be expected, given that a La Nina influence is present in both cases. The key question is whether there is something distinct about the 1974-75 pattern (or the whole 1973-76 evolution) from the typical La Nina pattern that can inform us about what to expect in the coming winter. Answering that question cannot be done with observational data alone, as the sample size is too small and the chaotic climate variability too large, so we would need some detailed modeling study to complement the observational data. But it's something to consider!
Modoki La Niña?
From Tropical Tidbits daily updates wrt values for the different Niño regions, Nino.4 has been warming since the beginning of June. As for now, the negative anomalies in Niño.4 and Niño 1+2 are roughly the same while Niño.3 have the least negative anomalies. For now, what are the odds of a developing Modoki La Niña?
Cheers!
Modoki
Although we recognize that ENSO has different "flavors," and that no two events are identical, NOAA does not officially distinguish between "Eastern Pacific" and "Modoki" El Nino or La Nina. One reason is that La Nina (and weak El Nino) tend to be centered farther west than strong El Nino in general, as I covered in this post. Therefore, it's pretty typical for La Nina to have a Modoki-like appearance.
With that said, I know that some research scientists distinguish the types of La Nina, and it will be interesting to see this particular sea surface temperature pattern evolves. The sea surface temperatures in each of the Nino regions can have some pretty dramatic swings over periods of a few weeks, so it's tough to say how the Nino 4/Nino 3/Nino 1+2 relationships will play out until we get into the fall.
Modoki
Thanks Nathaniel for that great explanation. I visited the Jamstec site in the past and Japanese researchers seem to make this distinction. They have even come up with a mathematical formula to determine a modoki event and have a modoki index.
How accurate do you believe SST plumes are in the short term, over a period of a couple months or so?
The skill of many of the…
The skill of many of the model forecasts for Nino 3.4 is available from the providers and generally shows a root mean square error of about 0.5C for forecasts looking out a couple of months, with a correlation of over 0.8. Here's a link for the skill of the CFS, available from the CPC webpage:
https://www.cpc.ncep.noaa.gov/products/people/mchen/CFSv2HCST/metrics/r…
Thanks Mike!
Thanks Mike!
Negative anomaly under the Azores
Hi everyone.
Just two questions: by looking at the SSTa in the Atlantic ocean, there's a noticeable anomaly that is permantly stretching from northern Portugal to the waters in front of Puerto Rico. Could be this strange anomaly been reinforced by the walker circulation described above? And so, in your opinion, will be permanent until Ninã's pattern will not change? In my opinion this anomaly is probably the main reason of the droughts in Europe and the undertone Atlantic Hurricane season so far.
Thanks in advance
Mario
Strange couple of summers
I've lived in Metro Phoenix for more than 40 years and the last summer, as well as this summ er, have been strange to say the least. I certainty can't remember so many August days 100° or below for so many consecutive days. Last summer with days not even hitting 90s.
It's nice to have some summer storms to keep temps low but it's really the winter snow and rains that help the drought and refill the reservoirs. That slow snow melt keeps mountains rivers flowing into the lakes. Was very dry last winter so let's hope for that neutral for the last winter rain and snow up north!!!
Another strong summer...but need winter
Over 5" last summer, per my weather station around 55th and Bell in Metro Phoenix. Approaching 4" so far this summer. But, it's really the Winter snow we need to replenish the mountain rivers and lakes/reservoirs! Although I love the mild winters, let's hope for neutral by January so we can get some snow up north before April! We need a few years of El Nino so we can bounce back.
Add new comment