Winter Outlook 2014-2015
2 min, 31 seconds
NOAA meterologist Mike Halpert recaps the Climate Prediction Center's seasonal climate outlook for December 2014-February 2015.
Details
Video Transcript
Mike Halpert:
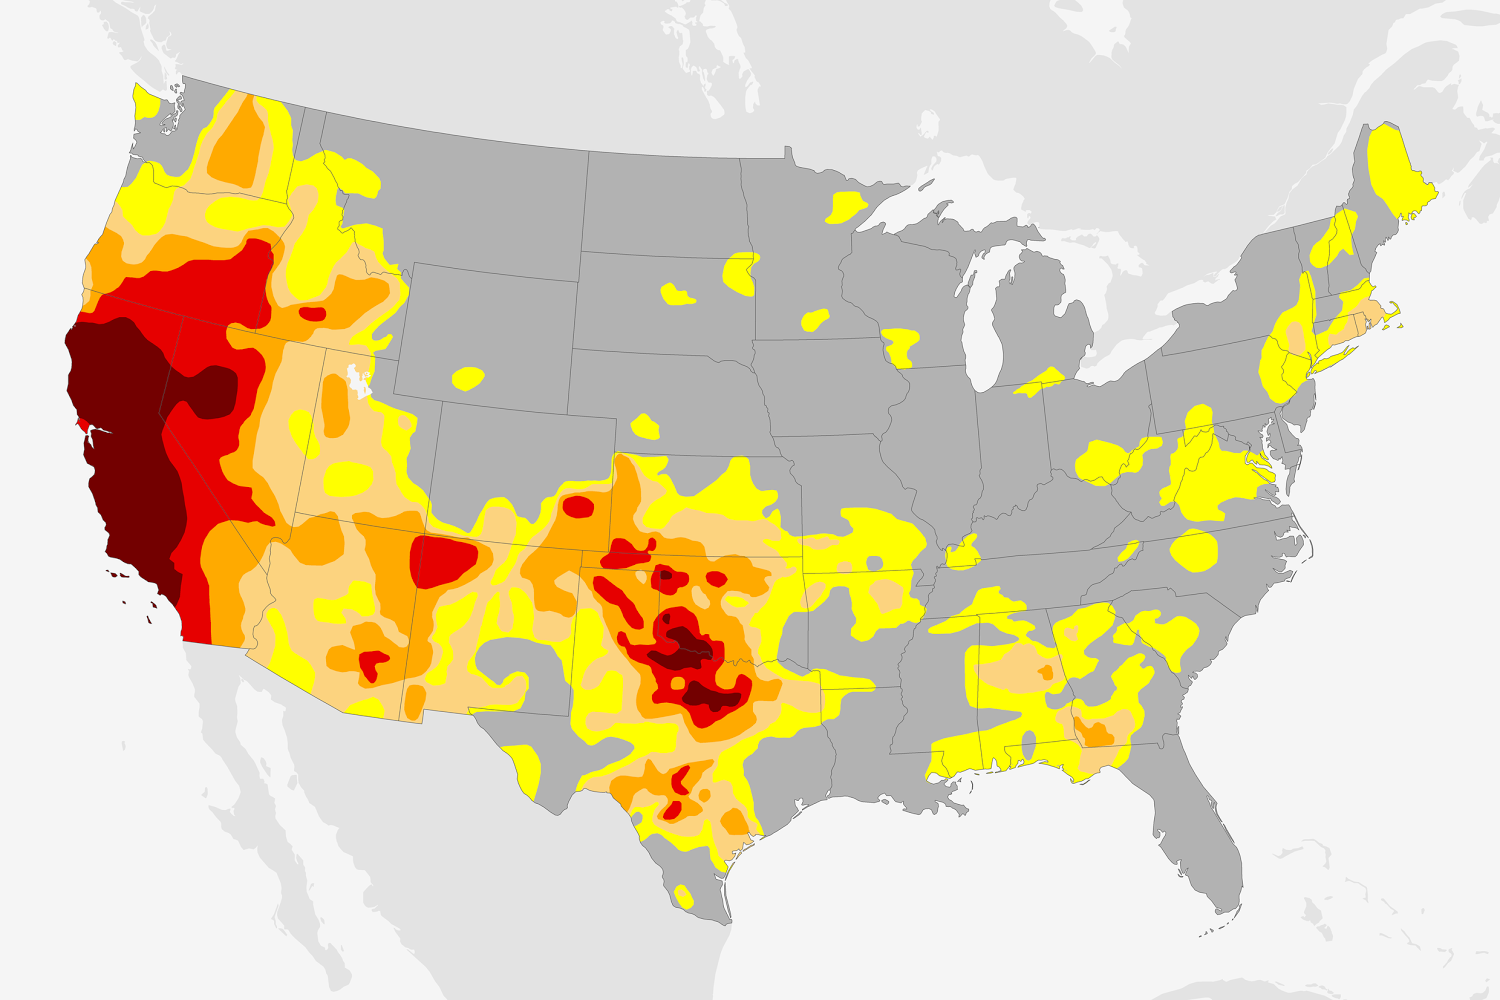
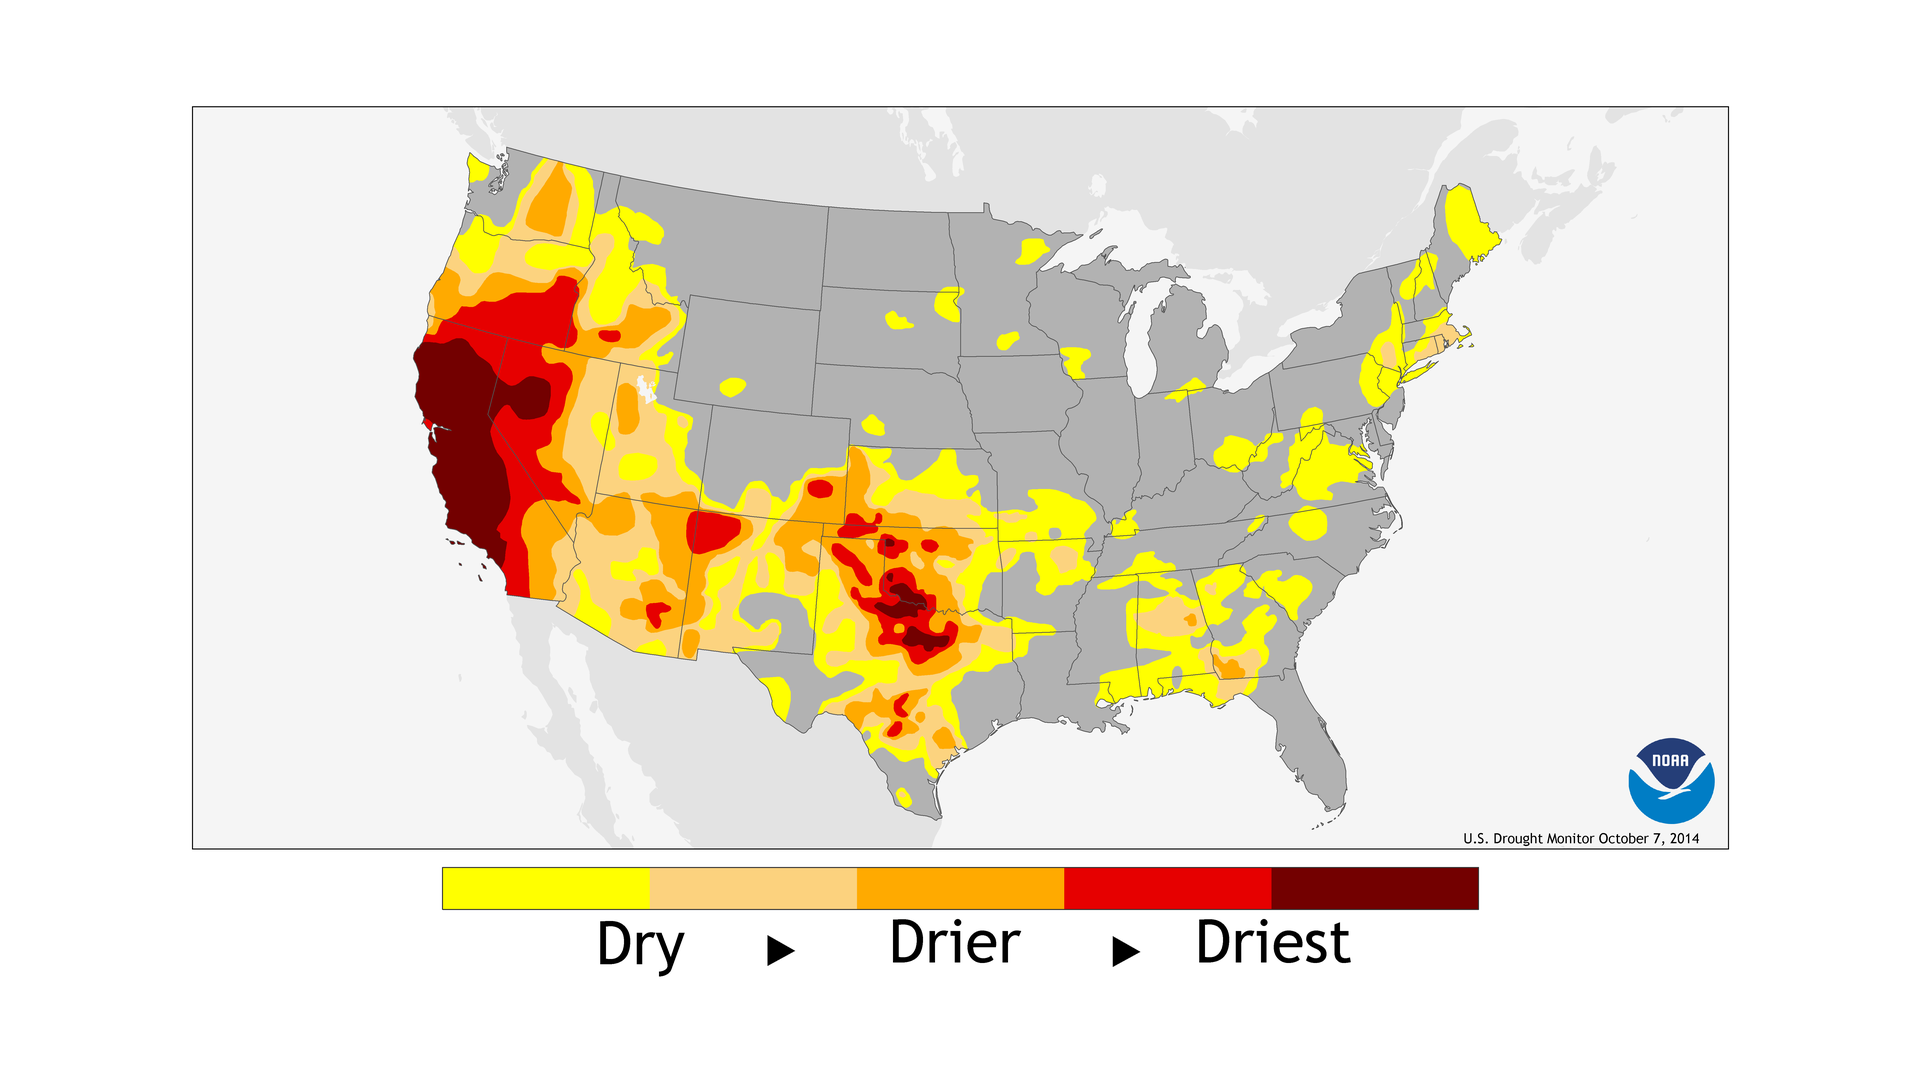
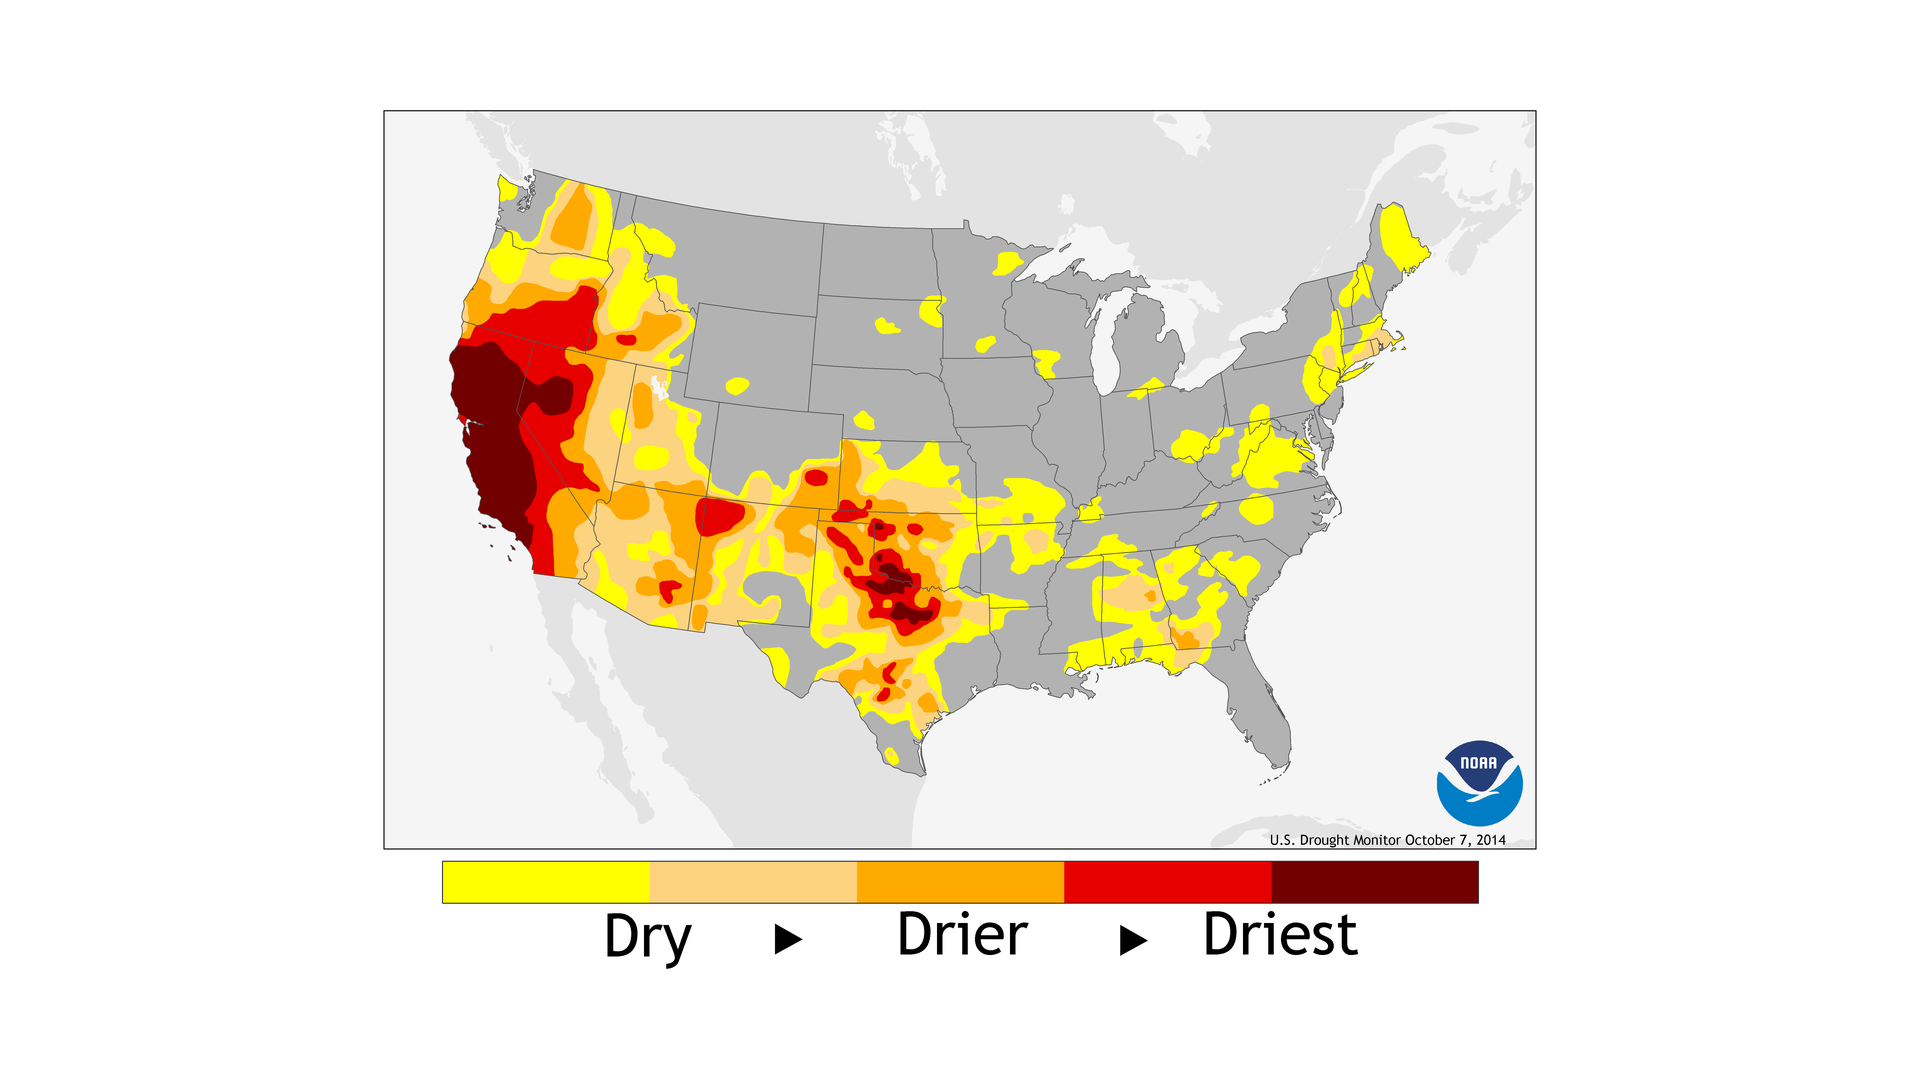
Last year much of the country experienced a cold and snowy winter, while out west conditions were extremely dry. As we approach this winter, people across the nation are wondering what to expect.
After one of its driest years on record, nearly 60 percent of California is suffering from exceptional drought. Much of their annual precipitation falls during the winter. And while the much-hoped-for strong El Niño has not materialized, there is at least a 2-in-3 chance that wintertime precipitation will be near or above average throughout the state. However, complete recovery is unlikely.
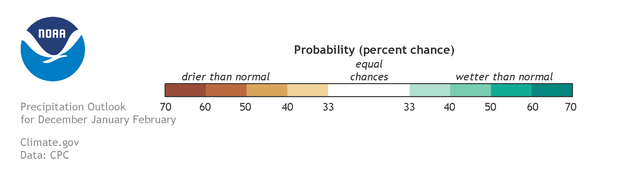
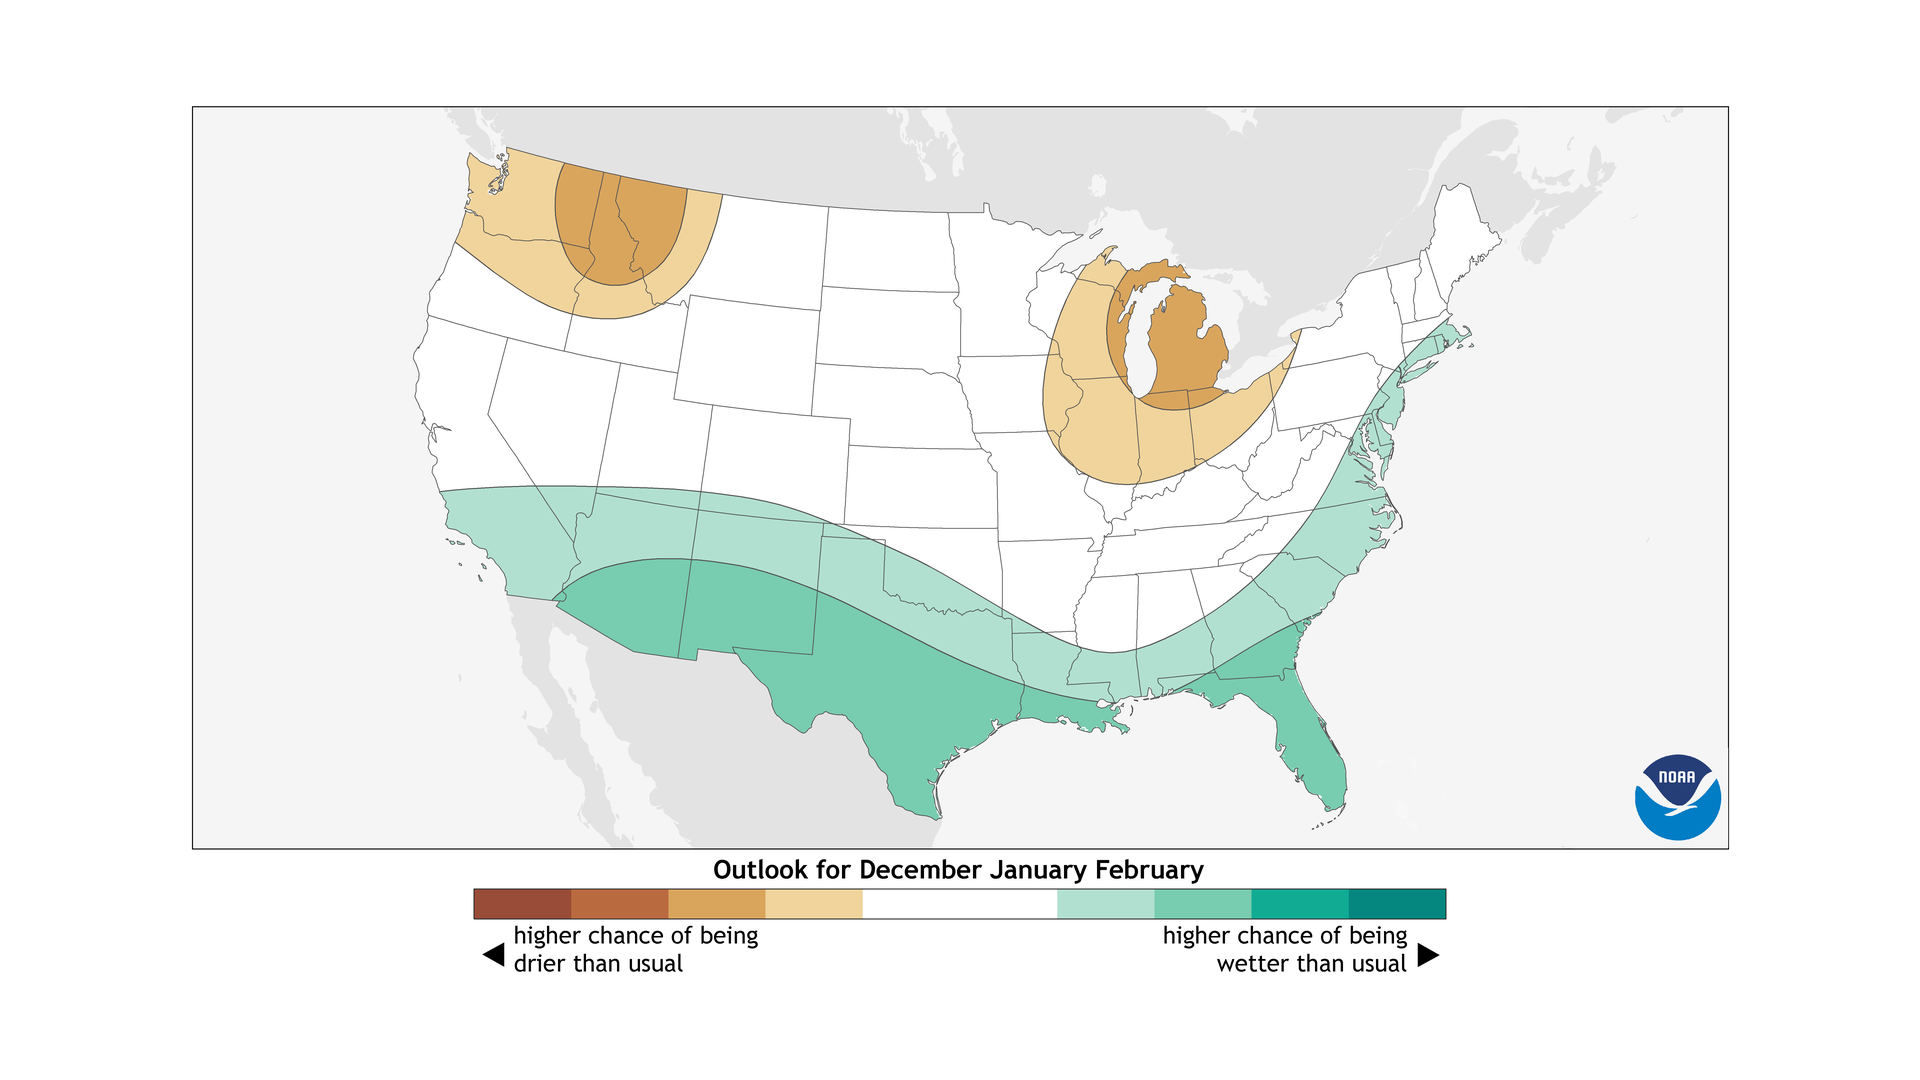
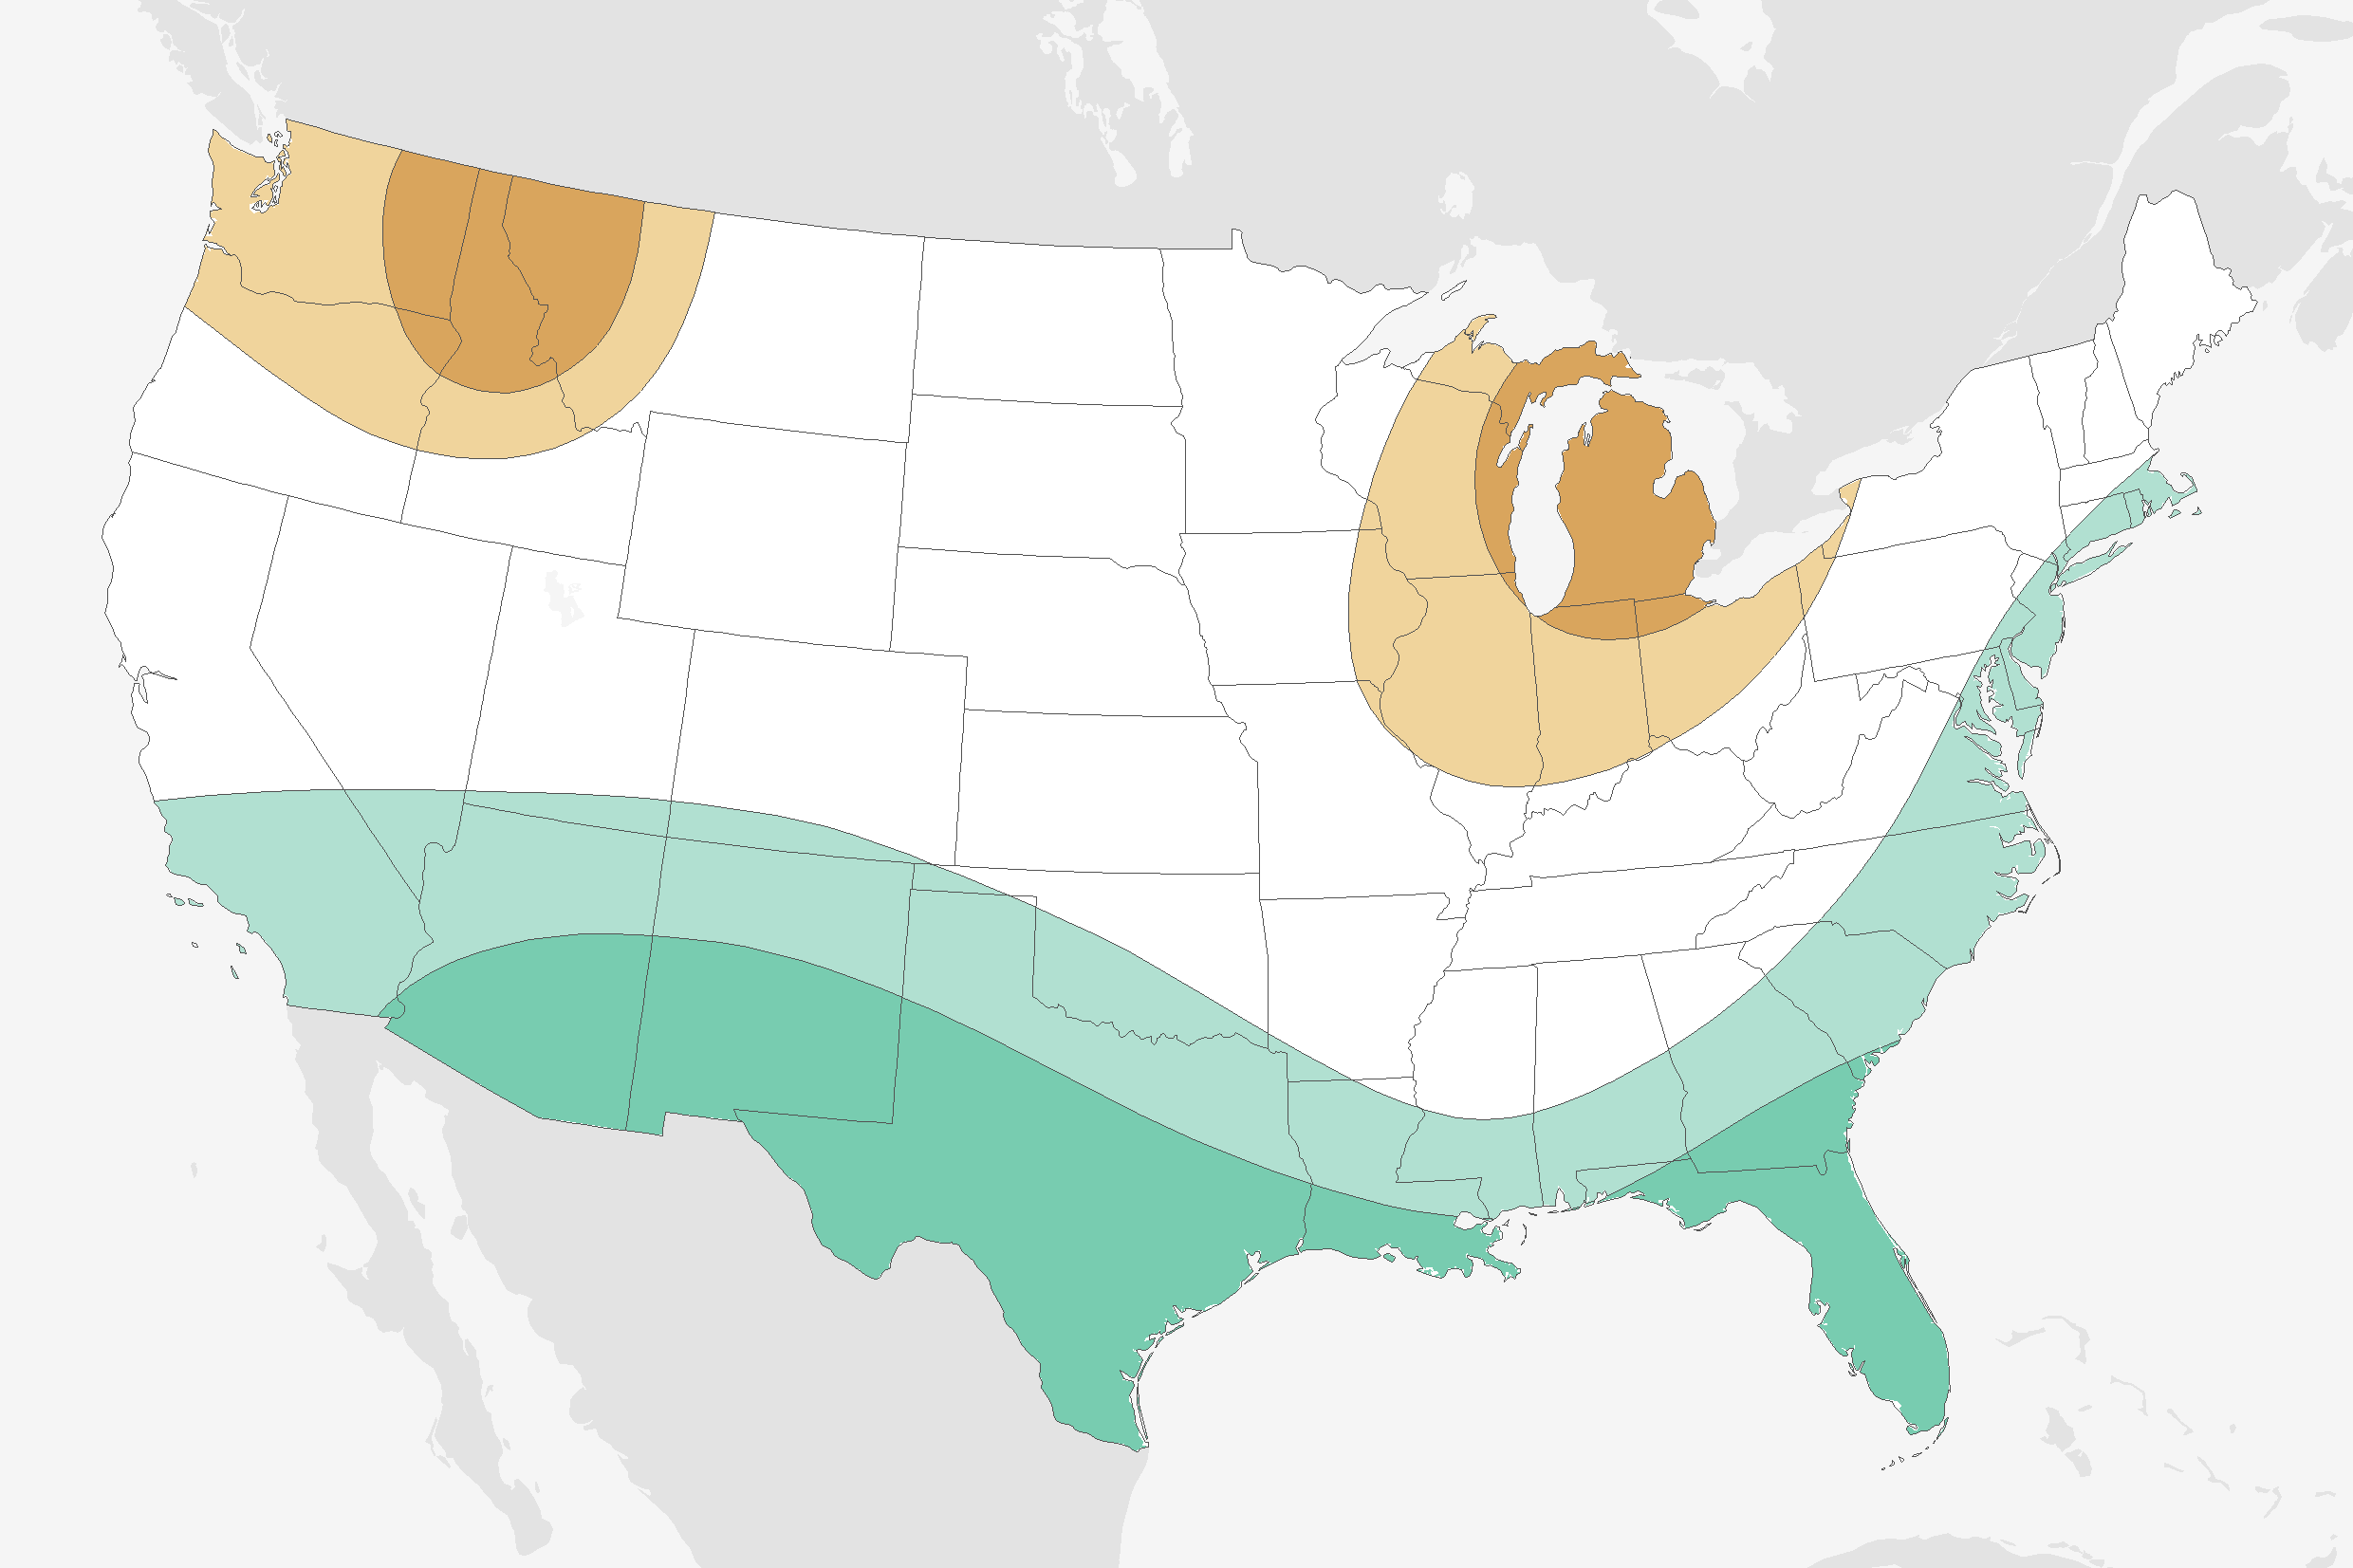
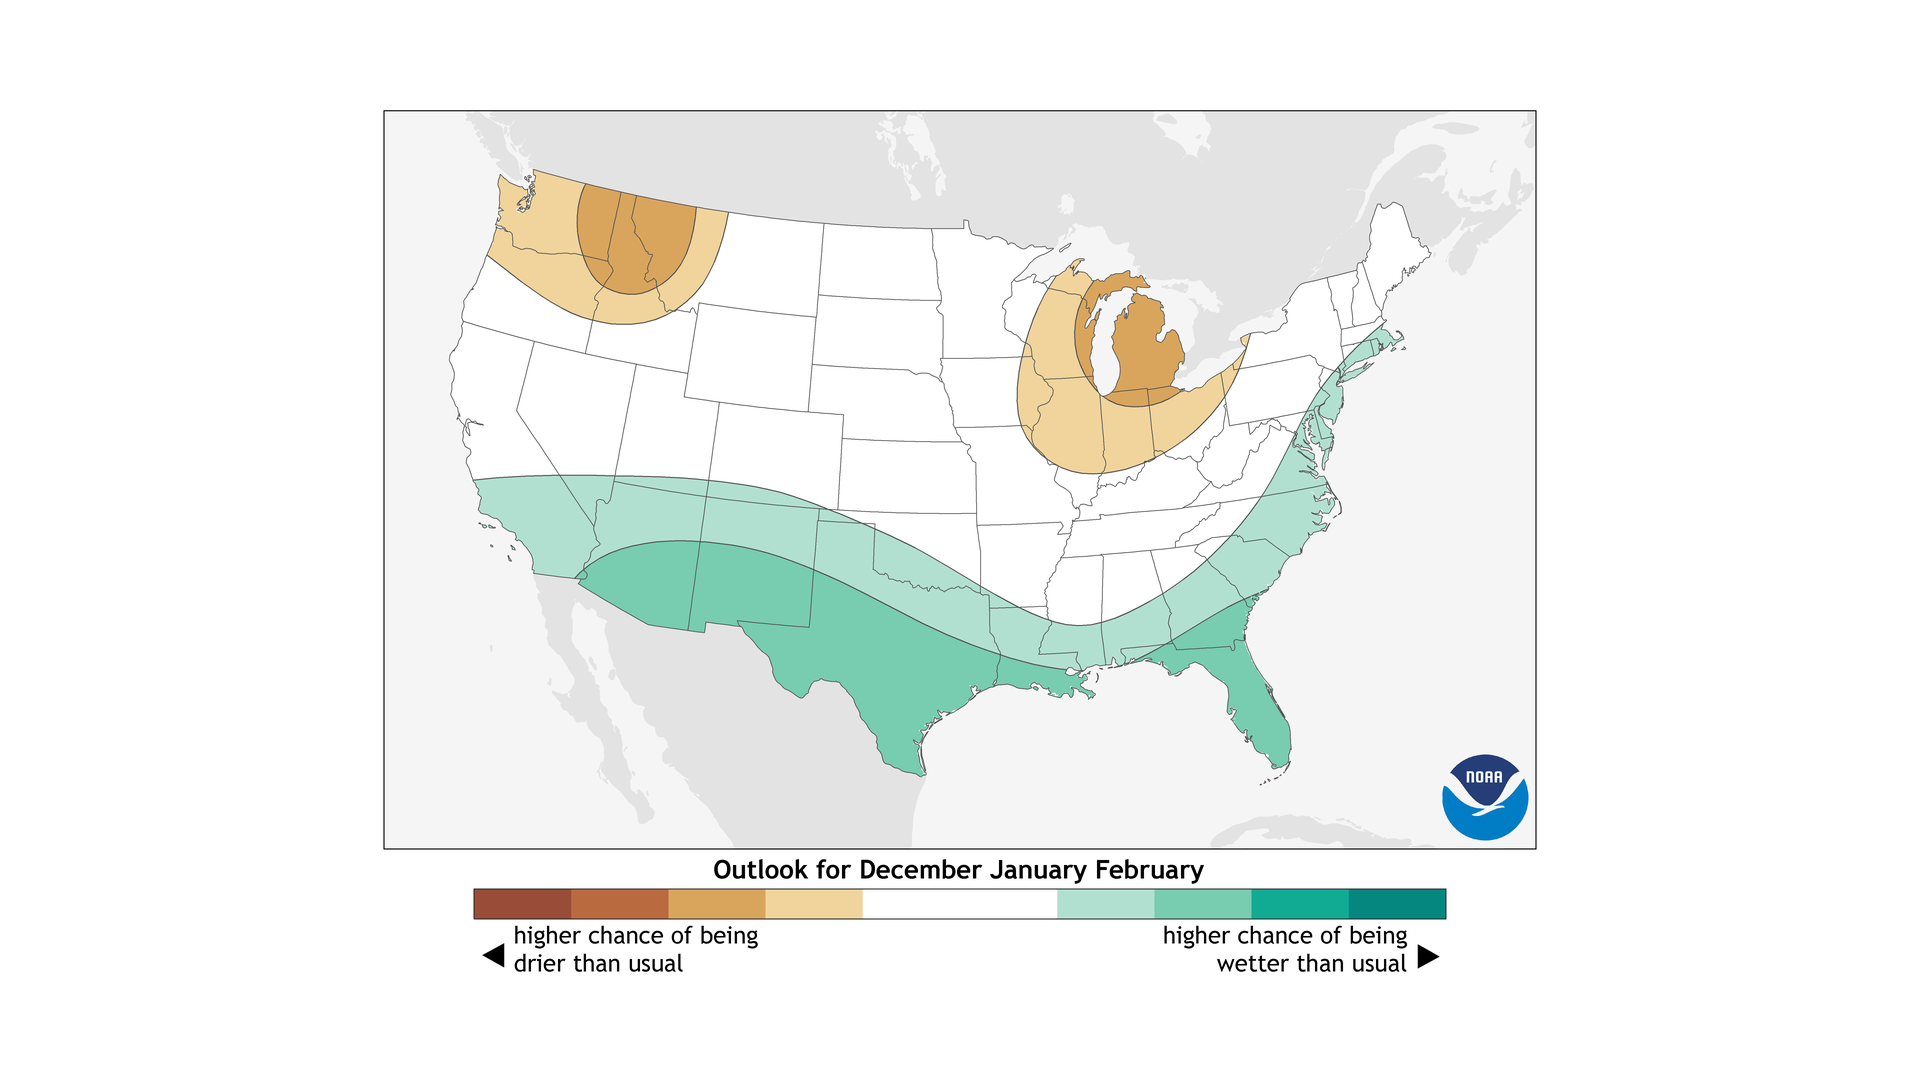
The odds lean toward a wetter-than-average winter across southern Alaska, across the southern part of the nation, and along the East Coast. In contrast, a drier-than-average season is favored in the Midwest and the Pacific Northwest.
Remember, these maps show only the most likely outcome. There is always some chance that seasonal amounts will be below-, near-, or above-average.
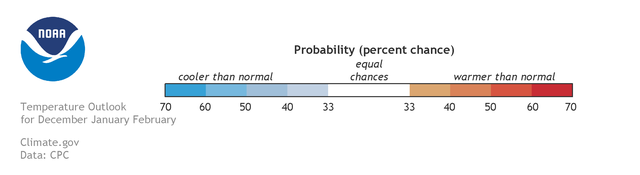
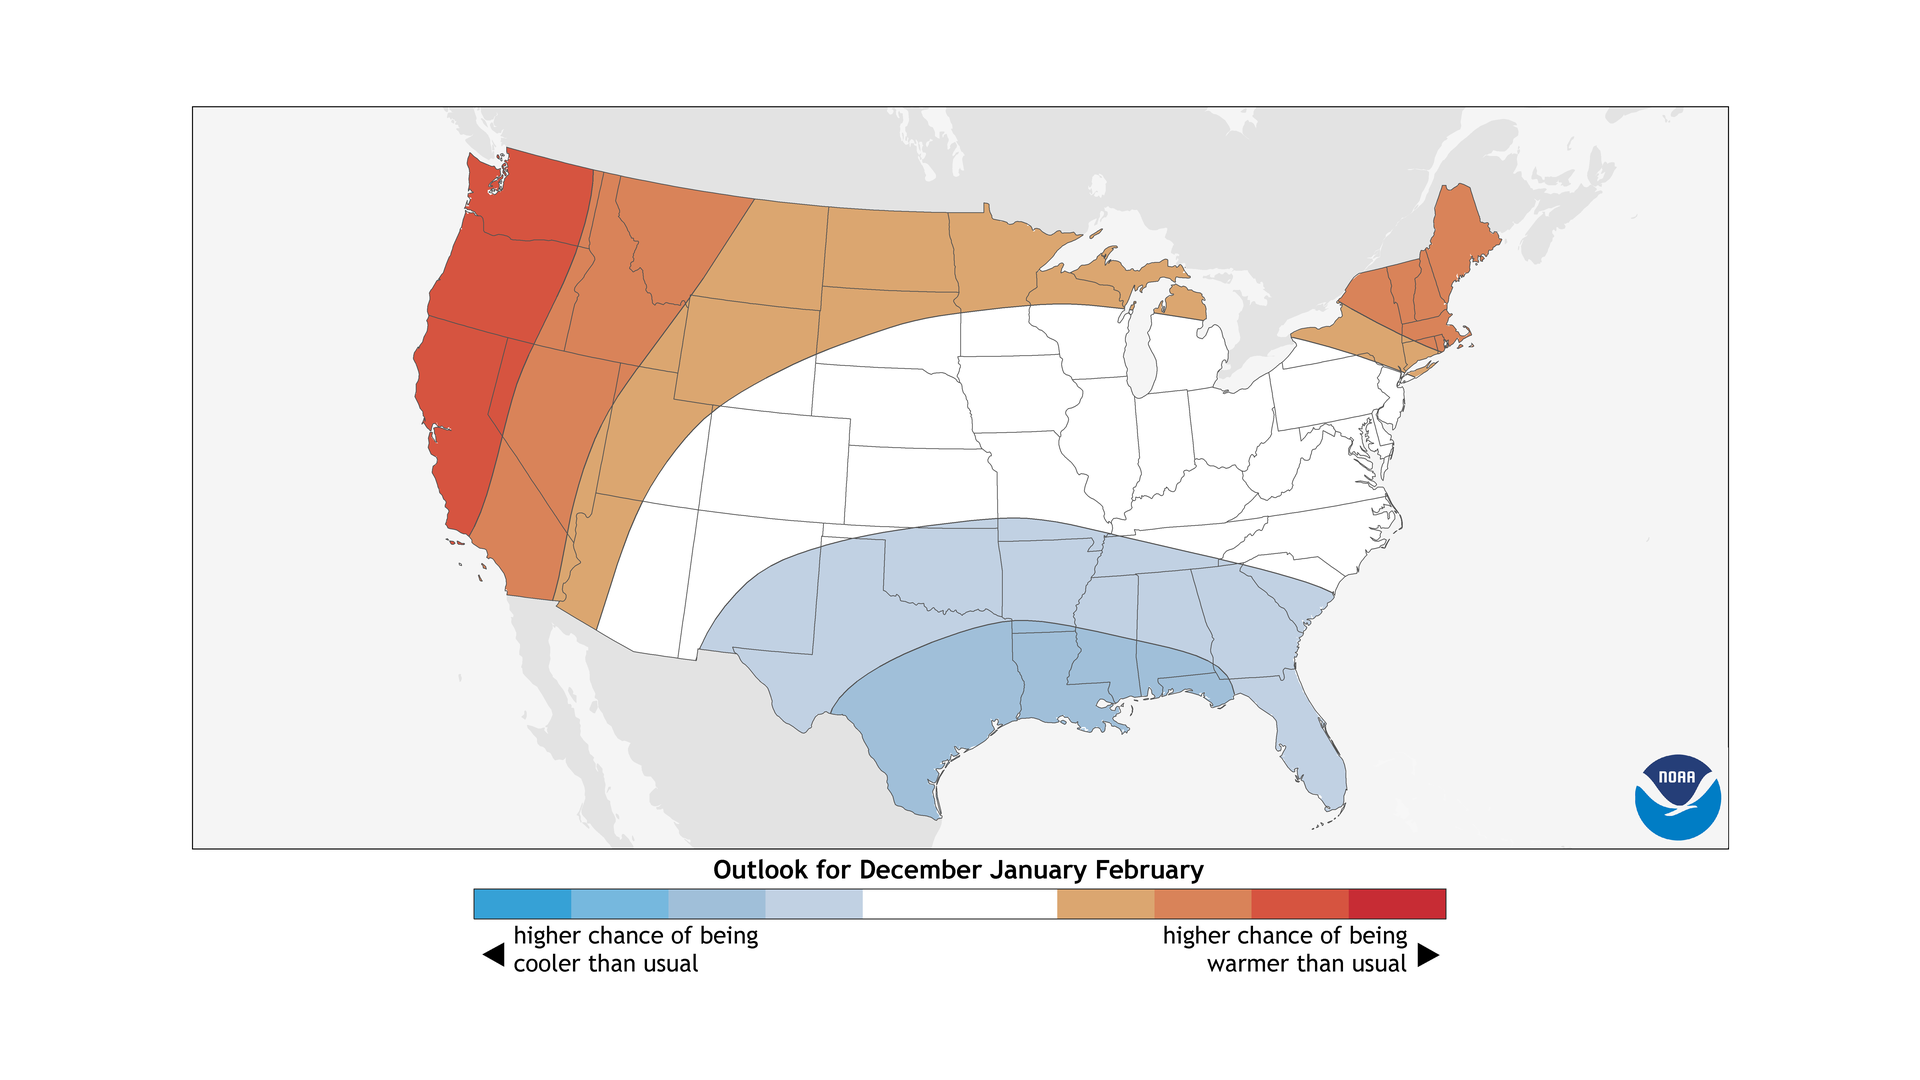
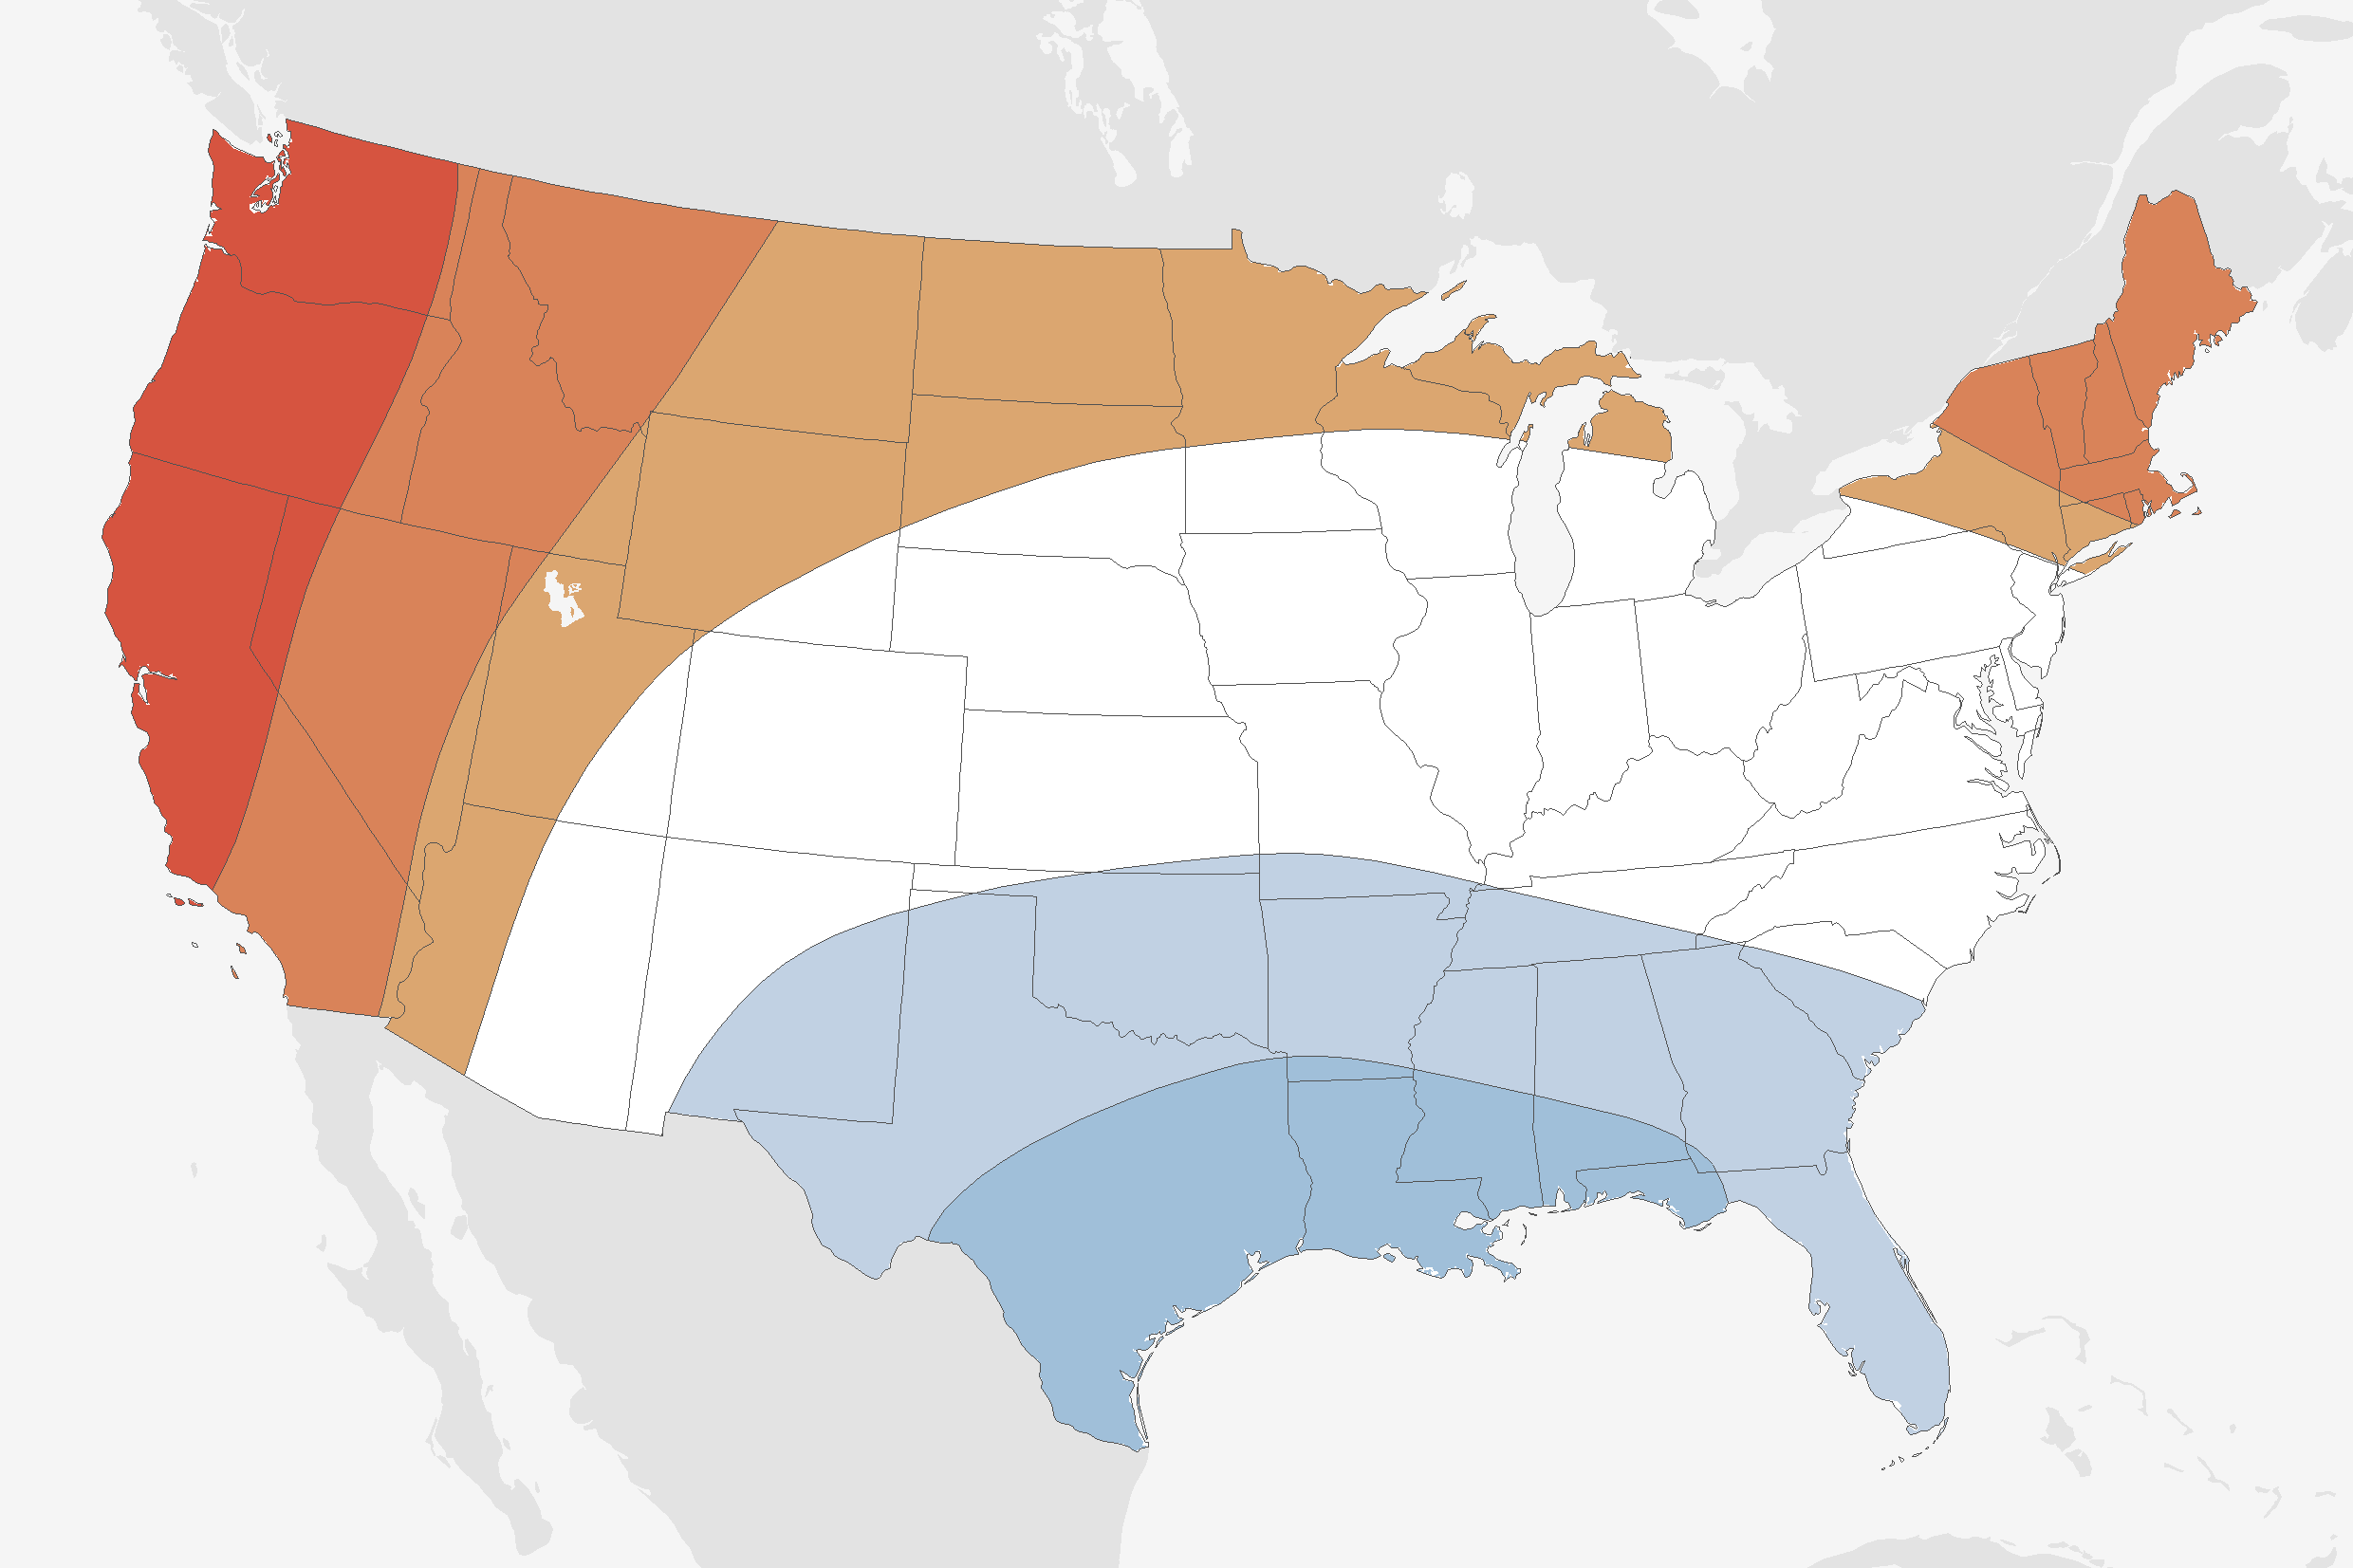
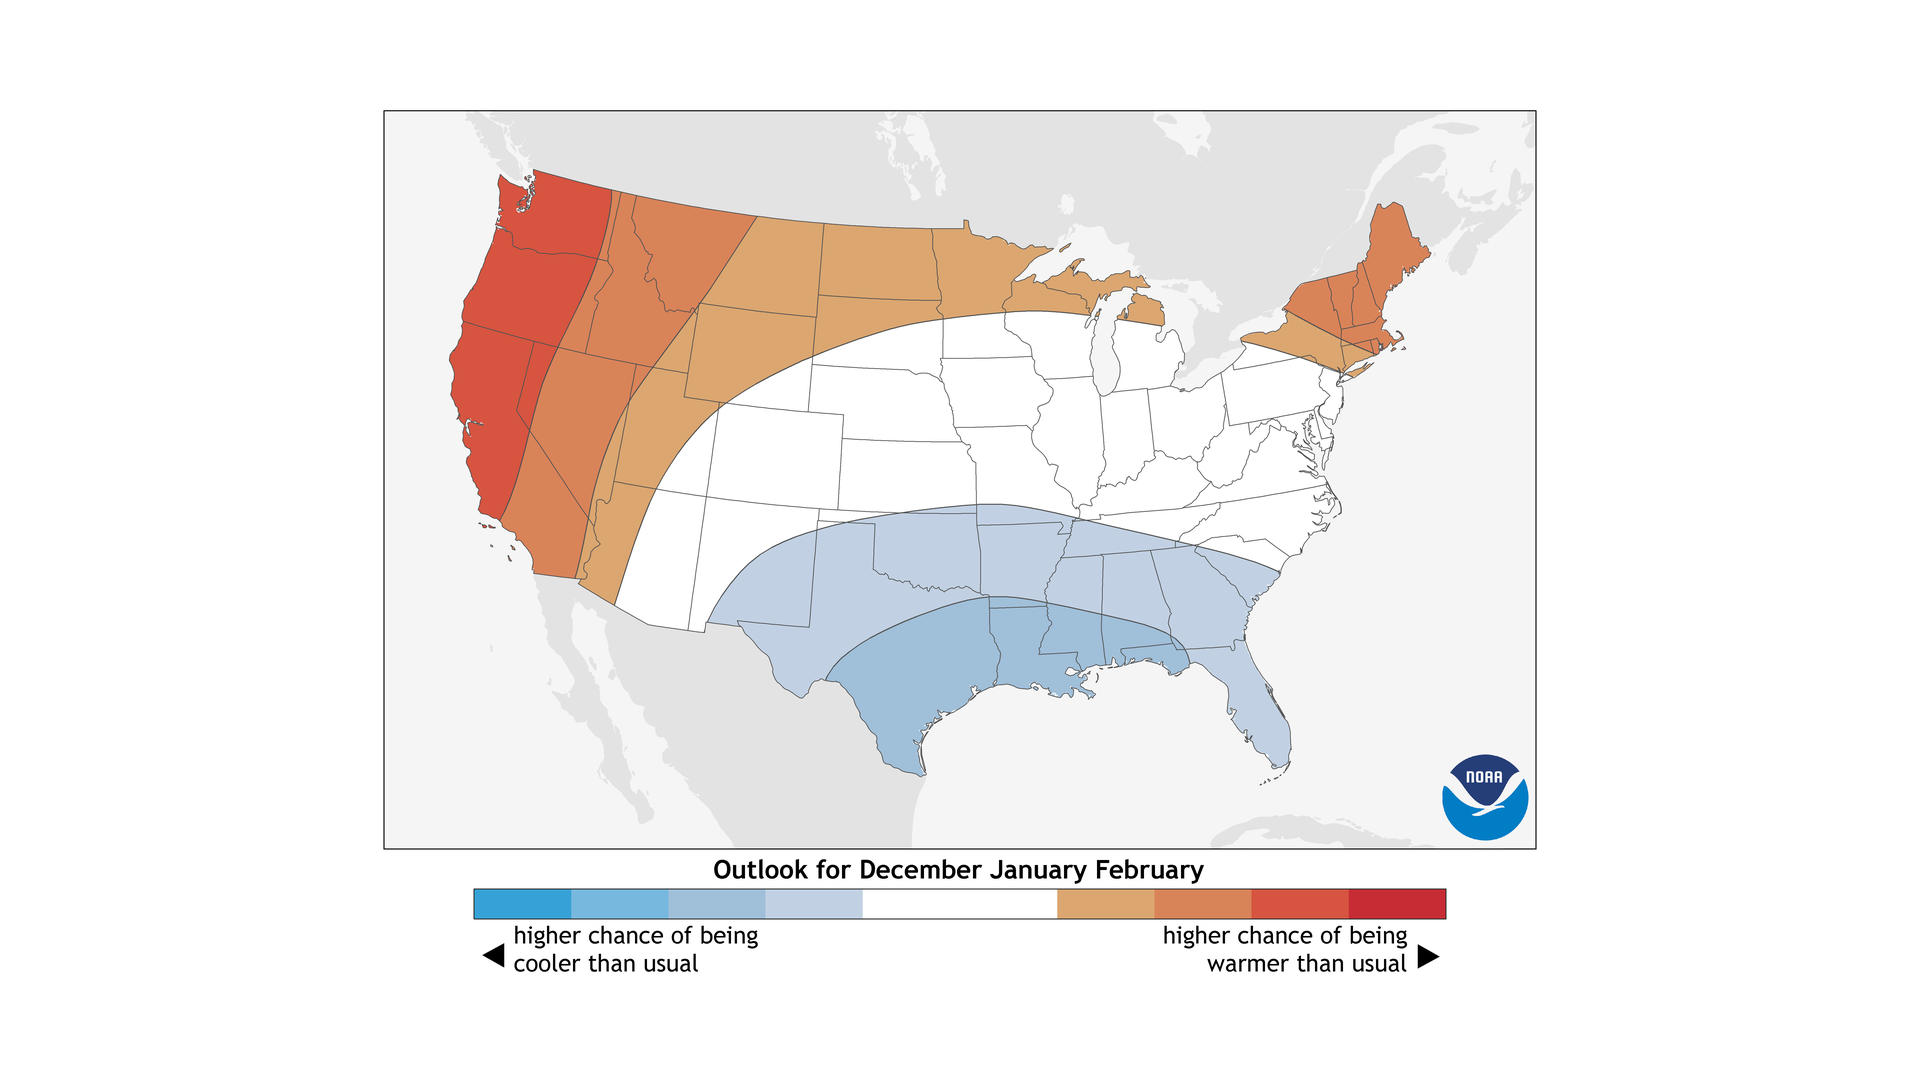
The temperature outlook favors a warmer-than-average winter in Alaska and also in a band extending from the West Coast through most of the intermountain West, and across the US-Canadian border to New England. Colder-than-average conditions are favored in the south-central and southeastern states.
Both maps have parts of the country labeled “EC” for “equal chances,” which means there is no tilt in the odds towards either above-, near- or below-average temperature or precipitation.
The events that make winter memorable, such as big snow storms, depend on conditions in the atmosphere which are just not predictable on time scales beyond a week or two. We routinely issue sub-seasonal outlooks that capture some of these transitory phenomena.
Seasonal outlooks offer insight into potential average conditions well in advance so you can prepare and become climate-smart.
From the Climate Prediction Center, I’m Mike Halpert.
Maps
Maps suitable for broadcast and print are available via the "additional assets" link to the right of the video above.
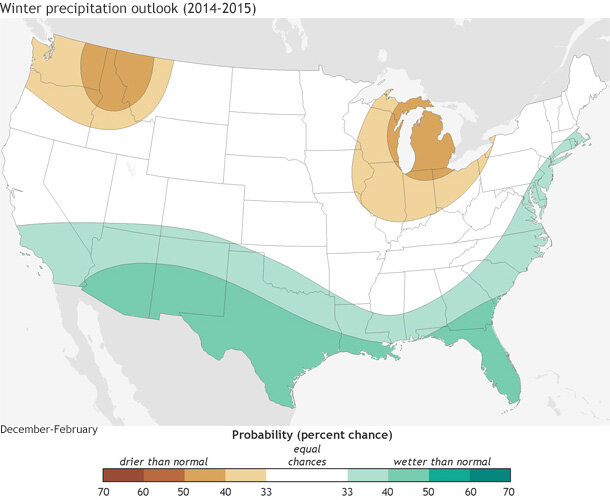
Chances of well above or well below average precipitation. Well above/below means in the upper/lower third of the historical record. White areas have equal chances for above, below, or near-normal precipitaiton. Maps by NOAA Climate.gov based on data from the Climate Prediction Center. Larger version (click image) includes Alaska.
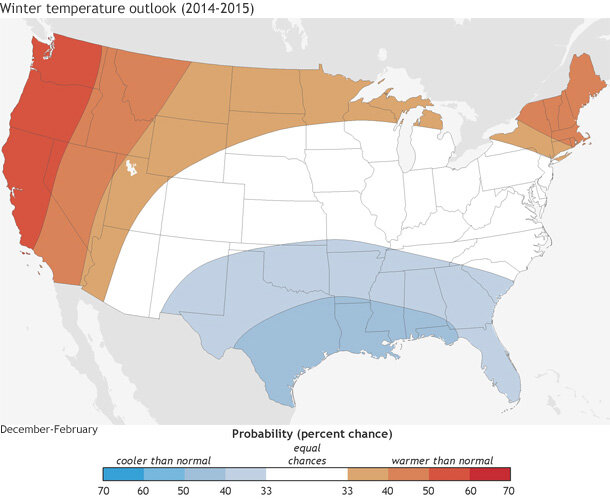
Chances of well above or well below average temperature. Well above/below means in the upper/lower third of the historical record. White areas have equal chances for above, below, or near-normal temperature. Maps by NOAA Climate.gov based on data from the Climate Prediction Center. Larger version (click image) includes Alaska.
Links
NOAA Prelease on the 2014-15 WInter Outlook
NOAA Climate Prediction Center
