The tropics as a prime suspect behind the warm-cold split over North America during recent winters
This is a guest post by Dennis L. Hartmann, who is a professor in the Department of Atmospheric Sciences at the University of Washington in Seattle. He literally wrote a textbook that was the foundation for our climate training (webpage and CV), so we’re pretty enthused he’s guest blogging with us—to put it mildly. Still, the Climate.gov managing editor asks us to remind our readers that all blog posts convey the opinions and ideas of individual bloggers, not NOAA.This post offers one expert’s view on a question that many scientists are exploring and debating.
So far this winter it has been warm and dry in the West and cold and snowy in the East. As I write from Seattle, it is sunny and in the mid-fifties, and the Olympic Mountains have very little snow on them for late winter. Meanwhile it is 25°F in Chicago, and Boston is bracing for another snowstorm that might bring their total closer to the snowiest season on record.
This winter bears some similarity to the record-breaking “Polar Vortex” winter of 2013-14, which was the second coldest on record for Chicago and was associated with an unusual seasonal pressure pattern that contributed to drought in California (Seager et al. 2014).
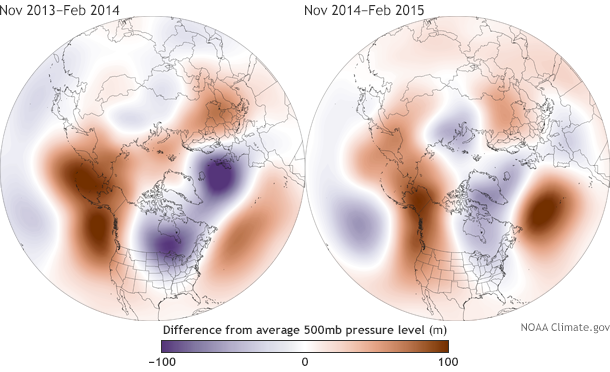
Atmospheric height anomaly maps (at the 500hPa/500mb pressure level) for last winter (November 2013-February 2014) and this winter (November 2014-February 2015. Maps by NOAA Climate.gov based on NCEP/NCAR reanalysis data.
Patterns of SST variability
Figure 1 shows the circulation anomalies (departures from average pressure as measured by the 500hPa geopotential height field) for the winters of 2013-14 and 2014-15, so far. Over the Pacific and North America for both winters, this pattern favors warm and dry in the West and cold in the East, with some differences in details.
People have speculated that this weather ‘weirding’ might have to do with global warming, either through the Arctic Sea Ice decline (Francis and Vavrus 2012), or through warming of the tropical oceans (Palmer 2014; Wang et al. 2014). I will argue here that these anomalies can be seen in past patterns of natural variability, and are likely caused by sea surface temperature changes in the tropics. I will not address the question of whether the probability or intensity of this pattern might be influenced by global warming.
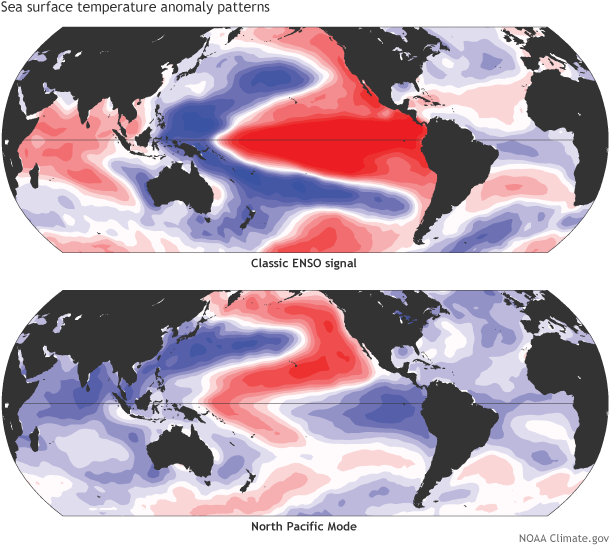
The two most common sea surface temperature correlation patterns in Pacific Ocean north of 30°S over time, based on EOF analysis. The first is the classic ENSO signal, while the second is the North Pacific Mode. The contour interval is 0.1, and the zero contour is white. Red and blue show correlations between anomalies of opposite sign. When red areas have above-average SSTs, blue areas have below-average SSTs, and vice versa. See Hartmann (2015) for regression plots in units of ˚C.
While ENSO accounts for much of the tropical ocean-atmosphere variability that dominates climate from year-to-year, classic ENSO indices do not account for everything. In addition to the classic ENSO signal of sea surface temperature (SST) variability, decadal signals of SST variability exist that exhibit strong coupling between the tropics and higher latitudes (Hartmann 2015). Figure 2 shows the two most important patterns of SST variability for the Pacific Ocean region north of 30S. The first of these is the classic ENSO pattern, while the second can be called the North Pacific Mode (2)(3).
The North Pacific Mode pattern consists of above-average SSTs in the western Tropical Pacific that extend north along the California coast and across the far northern Pacific Ocean. It is thus a pattern of natural variability in the coupled ocean-atmosphere-land system that connects the tropical and middle latitudes. While ENSO has been in a neutral state for the past few winters, the NPM has been in an extreme positive state since the summer of 2013 (Figure 3).
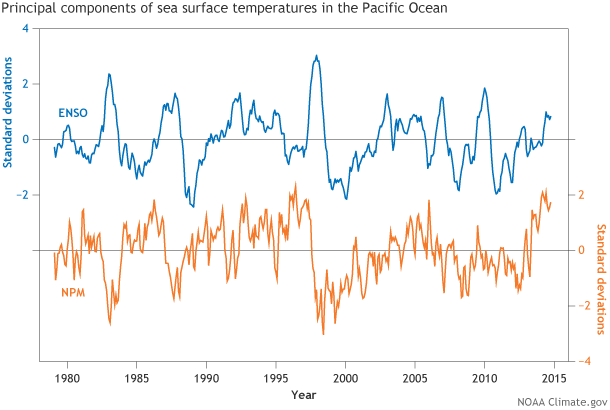
Monthly time series of ENSO (top, blue line) and North Pacific Mode (NPM) (below, orange line) in the Pacific Ocean north of 30°S from January 1979 to January 2015. Units are in standard deviations from the mean. The NPM has been highly positive since the summer of 2013. Graph by Fiona Martin, based on data provided by Dennis Hartmann.
The downstream influence of the North Pacific Mode
The North Pacific Mode SST pattern (Figure 2 bottom) is associated in the observational record with a 500hPa height anomaly pattern that looks very similar to the seasonal anomaly pattern from the winters of 2013-14 and 2014-15, with a ridge along the Rockies and a deep trough over the middle of North America (compare Figure 4 (left) with Figure 1). This pattern brings warmth and drought to the West and cold to the East, as we have observed the past two winters.
Of course, it’s possible for the patterns of SST and 500hPa height to be associated—to occur at the same time—without one being the cause of the other. But by using the observed SST under atmospheric models and performing many test simulations of the period from 1979 to the present, it can be shown that the SST anomalies associated with the North Pacific Mode do drive the “downstream” pressure anomalies over North America (Hartmann 2015). Figure 4 (map on right) shows that the simulated 500hPa anomalies produce a pattern that is very much like the observed one (compare Figure 4 left and right) (4).
We therefore know that the SST anomalies in the Pacific were a prime cause of the “Polar Vortex” winter of 2013-14. Since the SST anomaly pattern persisted into this winter (Figure 3), it is reasonable to suppose that the SST anomalies are also contributing to the warm, dry West and cold East anomalies experienced so far in 2015.
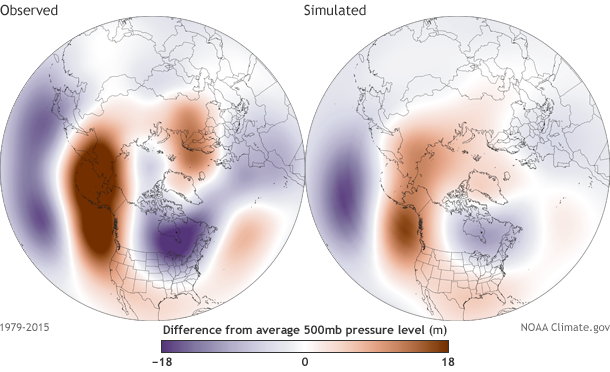
Regression analysis showing pressure anomalies associated with variability in the North Pacific Mode since 1979 (from Figure 2). Observed 500hPa height anomalies during the positive phase of the NPM, based on NCEP reanalysis data (left). Simulated pressure anomaly patterns from models (ESRLv2 50-member model ensemble) forced by sea surface temperature patterns derived from the same NPM time series (right). Maps by NOAA Climate.gov, based on data provided by Dennis Hartmann.
Based on many observational and modeling studies, we know that seasonal anomalies in SST and weather in the midlatitudes can be driven by tropical SST anomalies. The tropical ocean area is large, and the atmospheric heating is sensitive to tropical SST anomalies (Lau and Nath, 1994). My colleagues Paulo Ceppi at the University of Washington and Peter Watson at Oxford University have run some initial model experiments indicating that the observed SST anomalies in the tropical Pacific Ocean cause the extratropical height anomalies of the winter of 2013-14 in models. We therefore believe that the anomalous weather in North America during the winters of 2013-14 and 2014-15 is related to the warm SST anomalies in the western tropical Pacific (as part of the North Pacific Mode pattern shown in Figure 2), which have persisted since the middle of 2013.
Although the North Pacific Mode is known to be a product of natural variability associated in some way with ENSO, this mode of variability has become more prominent since 1979. Whether the enhanced importance of this mode is related to natural variability, global warming, or just changes in observing systems, is, I think, unknown at this point.
The CMIP3 and CMIP5 global warming simulations (5) move toward a more El Niño-like state in the eastern equatorial Pacific where, on average, the models warm the SST more than in the tropics as a whole. The models are not in agreement on this, however, and there is low confidence in changes in the intensity and spatial pattern of El Niño in a warmer climate (Christensen et al. 2013).
Meanwhile, a major El Niño has not occurred since 1998, but some strong La Niñas have (Figure 3), so that nature has moved more toward a La Niña state over the past 15 years. So while we are fairly sure that tropical SSTs are the apparent cause of the unusual nature of our past couple of winters, we do not know for sure whether this is just part of the natural variability of climate, or whether climate change is favoring the positive phase of the North Pacific Mode of SST variability.
Footnotes
(1) The most common patterns are determined by EOF analysis, which is short for Empirical Orthogonal Function. EOFs are statistical ways to identity the pattern and time series that is associated with the largest amount of variability. The pattern that is associated with the largest amount of variability is often referred to as EOF/Principal Component-1 or as the leading pattern of variability. This analysis used standardized data.
(2) I have used correlation patterns here rather than regressions showing temperatures in degrees to better reveal the connections to the tropics, where small changes in temperature can be more important because the temperature is already high and the highest temperatures are “felt” by the global atmosphere. In other words, we want to look at the strength of the relationship between SST in different locations more than the actual amount of the temperature variation involved.
(3) The North Pacific Mode (NPM) described here is distinct from both the Pacific Decadal Oscillation (PDO) and the El Niño-Southern Oscillation (ENSO). The NPM is often in its positive phase as shown in Fig. 1b just prior to an ENSO warm event, but not always. It is related to the ‘seasonal fingerprinting’ mechanism (Vimont et al. 2003) whereby tropical-extratropical interactions can set the stage for El Niño.
(4) The degree of similarity between the simulated and the observed patterns is determined objectively by applying a regression of the simulated 500hPa anomalies onto the time series of the observed NPM SST model. The modeled response is a little weaker and is missing some components in the far north, but the structure of the wave train that affects the United States is well simulated by simply specifying the observed SST.
(5) CMIP stands for the Couple Model Intercomparison Project and studies the differences in coupled atmosphere-ocean general circulation models. CMIP3 refers to the third phase of the project and was used as new data in the IPCC Fourth Assessment. CMIP5 is the fifth and most recent set of simulations that was used for the IPCC Fifth Assessment.
References:
Christensen, J. H., and Coauthors, Eds., 2013: Climate Phenomena and their Relevance for Future Regional Climate Change. In: Climate Change 2013: The Physical Science Basis, Contribution of Working Group I to the Fifth assessment Report of the Intergovernmental Panel on Climate Change. Cambridge University Press.
Francis, J. A., and S. J. Vavrus, 2012: Evidence linking Arctic amplification to extreme weather in mid-latitudes. Geophys. Res. Lett. 39, doi:10.1029/2012gl051000.
Hartmann, D. L., 2015: Pacific Sea Surface Temperature and the Winter of 2014. Geophys. Res. Lett.43, DOI: 10.1002/2015GL063083.
Lau, N. C., and M. J. Nath, 1994: A Modeling Study of the Relative Roles of Tropical and Extratropical SST Anomalies in the Variability of the Global Atmosphere Ocean System. J. Climate, 7, 1184-1207.
Palmer, T., 2014: Record-breaking winters and global climate change. Science, 344, 803-804.
Seager, R., and Coauthors, 2014: Causes and Predictability of the 2011-14 California Drought, doi:10.7289/V7258K7771F, 40pp.
Vimont, D. J., J. M. Wallace, and D. S. Battisti, 2003: The seasonal footprinting mechanism in the Pacific: Implications for ENSO. J. Climate, 16, 2668-2675.
Wang, S. Y., L. Hipps, R. R. Gillies, and J.-H. Yoon, 2014: Probable causes of the abnormal ridge accompanying the 2013–2014 California drought: ENSO precursor and anthropogenic warming footprint. Geophys. Rese. Lett., 41, doi:10.1002/2014GL059748.
-- Tom Di Liberto, lead reviewer
Comments
1996
RE: 1996
RE: RE: 1996
RE: RE: RE: 1996
RE: 1996
RE: RE: 1996
RE: RE: RE: 1996
RE: RE: RE: RE: 1996
Weather in LA
In 2023, LA has had SNOW and HURRICANE warning. Very strange.
PDO vs NPM
RE: PDO vs NPM
Winter 1976-1977
RE: Winter 1976-1977
Feedback Mechanisms.
RE: Feedback Mechanisms.
Hi Dennis,
RE: Hi Dennis,
No comment on AGW realities?
RE: No comment on AGW realities?
RE: RE: No comment on AGW realities?
Natural variability and forced response
RE: Natural variability and forced response
Great Stuff
North Pacific Gyre Oscillation
Winter 1976-1979, winter 2013-2015
update to 2016?
RE: update to 2016?
"blob mode"
North Pacific Mode
RE: North Pacific Mode
Update
RE: Update
I'm posting some accompanying graphics on Dennis' behalf. First, the updated time series below shows the three main modes of variability in the Pacific: (top graph) ENSO (principal component-1), (middle) the North Pacific Mode (principal component-2), and (bottom) "The Blob" (principal component-3.
[[{"fid":"40049","view_mode":"default","fields":{"format":"default","field_file_image_alt_text[und][0][value]":"Graph of the three main modes of sea surface temperature variability in the Pacific Ocean: ENSO, the North Pacific Mode, and The Blob","field_file_image_title_text[und][0][value]":"THree types of sea surface temperature variation in the Pacific Ocean from 1900 to 2020","field_caption[und][0][value]":"%3Cp%3EThe%20three%20main%20types%20of%20variability%20(%26quot%3Bprincipal%20components%26quot%3B%2C%20or%20%26quot%3BPC%26quot%3B)%20in%20sea%20surface%20temperatures%20in%20the%20Pacific%20Ocean%20from%201900-2020%3A%20(top%20to%20bottom)%20ENSO%2C%20the%20North%20Pacific%20Mode%2C%20and%20the%20Blob.%20Both%20the%20Blob%20and%20the%20North%20Pacific%20Mode%20were%20positive%20in%20early%20winter%202020%2F21.%20Figure%20by%20Dennis%20Hartmann.%3C%2Fp%3E%0A","field_caption[und][0][format]":"full_html"},"type":"media","field_deltas":{"1":{"format":"default","field_file_image_alt_text[und][0][value]":"Graph of the three main modes of sea surface temperature variability in the Pacific Ocean: ENSO, the North Pacific Mode, and The Blob","field_file_image_title_text[und][0][value]":"THree types of sea surface temperature variation in the Pacific Ocean from 1900 to 2020","field_caption[und][0][value]":"%3Cp%3EThe%20three%20main%20types%20of%20variability%20(%26quot%3Bprincipal%20components%26quot%3B%2C%20or%20%26quot%3BPC%26quot%3B)%20in%20sea%20surface%20temperatures%20in%20the%20Pacific%20Ocean%20from%201900-2020%3A%20(top%20to%20bottom)%20ENSO%2C%20the%20North%20Pacific%20Mode%2C%20and%20the%20Blob.%20Both%20the%20Blob%20and%20the%20North%20Pacific%20Mode%20were%20positive%20in%20early%20winter%202020%2F21.%20Figure%20by%20Dennis%20Hartmann.%3C%2Fp%3E%0A","field_caption[und][0][format]":"full_html"}},"link_text":null,"attributes":{"alt":"Graph of the three main modes of sea surface temperature variability in the Pacific Ocean: ENSO, the North Pacific Mode, and The Blob","title":"THree types of sea surface temperature variation in the Pacific Ocean from 1900 to 2020","class":"media-element file-default","data-delta":"1"}}]]
Second image shows the three main modes of variability as maps. The opposite colors mean that there is an opposite relationship of temperatures in those areas: the warm and cool locations that appear in one phase will switch places in the other phase of the pattern.
[[{"fid":"40050","view_mode":"default","fields":{"format":"default","field_file_image_alt_text[und][0][value]":"Trio of global maps shows the three main temperature patterns that dominate the variability of Pacific Ocean temperatures: (top to bottom) ENSO, the North Pacific Mode, and the Blob","field_file_image_title_text[und][0][value]":"The three main kinds of temperature variation in the Pacific Ocean: ENSO (PC-1), the North Pacific Mode (PC-22) and The Blob (PC-3) ","field_caption[und][0][value]":"%3Cp%3EThe%20variability%20of%20sea%20surface%20tempertures%20in%20the%20Pacific%20Ocean%20is%20dominated%20by%20three%20patterns%3A%20(top%20to%20bottom)%20the%20ENSO%20cycle%2C%20in%20which%20most%20of%20the%20tropical%20Pacific%20is%20warmer%20or%20coller%20than%20normal%3B%20the%20North%20Pacific%20Mode%2C%20in%20which%20a%20boomerang-shaped%20stretch%20of%20the%20North%20Pacific%20is%20alternately%20warmer%20or%20cooler%20than%20average%2C%20and%20%26quot%3BThe%20Blob%2C%26quot%3B%20in%20which%20the%20far%20North%20Pacific%20near%20the%20Gulf%20of%20Alaska%20is%20intermittently%20extremely%20warm.%3C%2Fp%3E%0A","field_caption[und][0][format]":"full_html"},"type":"media","field_deltas":{"2":{"format":"default","field_file_image_alt_text[und][0][value]":"Trio of global maps shows the three main temperature patterns that dominate the variability of Pacific Ocean temperatures: (top to bottom) ENSO, the North Pacific Mode, and the Blob","field_file_image_title_text[und][0][value]":"The three main kinds of temperature variation in the Pacific Ocean: ENSO (PC-1), the North Pacific Mode (PC-22) and The Blob (PC-3) ","field_caption[und][0][value]":"%3Cp%3EThe%20variability%20of%20sea%20surface%20tempertures%20in%20the%20Pacific%20Ocean%20is%20dominated%20by%20three%20patterns%3A%20(top%20to%20bottom)%20the%20ENSO%20cycle%2C%20in%20which%20most%20of%20the%20tropical%20Pacific%20is%20warmer%20or%20coller%20than%20normal%3B%20the%20North%20Pacific%20Mode%2C%20in%20which%20a%20boomerang-shaped%20stretch%20of%20the%20North%20Pacific%20is%20alternately%20warmer%20or%20cooler%20than%20average%2C%20and%20%26quot%3BThe%20Blob%2C%26quot%3B%20in%20which%20the%20far%20North%20Pacific%20near%20the%20Gulf%20of%20Alaska%20is%20intermittently%20extremely%20warm.%3C%2Fp%3E%0A","field_caption[und][0][format]":"full_html"}},"link_text":null,"attributes":{"alt":"Trio of global maps shows the three main temperature patterns that dominate the variability of Pacific Ocean temperatures: (top to bottom) ENSO, the North Pacific Mode, and the Blob","title":"The three main kinds of temperature variation in the Pacific Ocean: ENSO (PC-1), the North Pacific Mode (PC-22) and The Blob (PC-3) ","class":"media-element file-default","data-delta":"2"}}]]
THe third figure is the SST patterns you get if you add together maps of each of the principal components according to their observed strength and phase in early winter 2020.
[[{"fid":"40051","view_mode":"default","fields":{"format":"default","field_file_image_alt_text[und][0][value]":"Maps showing the expected SST patterns in the Pacific based on adding up maps of the state of each of the three main modes of variability in early winter 2020","field_file_image_title_text[und][0][value]":"Expected Pacific SST patterns in early winter 2020 based on the observed state of the three main modes of variability","field_caption[und][0][value]":"%3Cp%3EMaps%20of%20the%20Pacific%20Ocean%20SST%20patterns%20that%20would%20be%20expected%20if%20we%20added%20up%20maps%20of%20the%20three%20main%20modes%20of%20variability%20according%20to%20their%20observed%20strength%20and%20phase%20in%20late%202020.%20(%3Cstrong%3EBottom%20map%3C%2Fstrong%3E)%20During%20that%20time%2C%20PC-2%20and%20PC-3%20(the%20North%20Pacific%20Mode%20and%20The%20Blob)%20were%20both%20positive%2C%20while%20PC-1%20(ENSO)%20was%20negative.%20(%3Cstrong%3ETop%20map%3C%2Fstrong%3E)%20the%20expected%20pattern%20if%20PC-2%20and%203%20are%20positive%20and%20PC%201%20is%20neutral.%3C%2Fp%3E%0A","field_caption[und][0][format]":"full_html"},"type":"media","field_deltas":{"3":{"format":"default","field_file_image_alt_text[und][0][value]":"Maps showing the expected SST patterns in the Pacific based on adding up maps of the state of each of the three main modes of variability in early winter 2020","field_file_image_title_text[und][0][value]":"Expected Pacific SST patterns in early winter 2020 based on the observed state of the three main modes of variability","field_caption[und][0][value]":"%3Cp%3EMaps%20of%20the%20Pacific%20Ocean%20SST%20patterns%20that%20would%20be%20expected%20if%20we%20added%20up%20maps%20of%20the%20three%20main%20modes%20of%20variability%20according%20to%20their%20observed%20strength%20and%20phase%20in%20late%202020.%20(%3Cstrong%3EBottom%20map%3C%2Fstrong%3E)%20During%20that%20time%2C%20PC-2%20and%20PC-3%20(the%20North%20Pacific%20Mode%20and%20The%20Blob)%20were%20both%20positive%2C%20while%20PC-1%20(ENSO)%20was%20negative.%20(%3Cstrong%3ETop%20map%3C%2Fstrong%3E)%20the%20expected%20pattern%20if%20PC-2%20and%203%20are%20positive%20and%20PC%201%20is%20neutral.%3C%2Fp%3E%0A","field_caption[und][0][format]":"full_html"}},"link_text":null,"attributes":{"alt":"Maps showing the expected SST patterns in the Pacific based on adding up maps of the state of each of the three main modes of variability in early winter 2020","title":"Expected Pacific SST patterns in early winter 2020 based on the observed state of the three main modes of variability","class":"media-element file-default","data-delta":"3"}}]]
Lastly, Hartmann asked me to post some graphics showing the patterns in cloudiness over the Pacific (the amount of cloudiness can be inferred from satellite observations of outgoing longwave radiation, or OLR) because thicker clouds block the escape of OLR from Earth's surface. Satellites will see less OLR than average when thick clouds are present, and they will see more OLR when areas that are usually cloudy are clear. He said via email:
Comments have been disabled on this article