Details on the April ENSO Forecast
Last month, we saw the first signs of an atmospheric response to the warmer-than-average sea surface temperatures that had been in place in the tropical Pacific for several months, leading us to declare the presence of El Niño conditions. In March, those conditions strengthened a bit. So what are the forecasters thinking this month?
We think the odds are roughly 70% that El Nino conditions will persistent though summer and above 60% that they will last through fall.
Where we are
First, let’s catch up on the details of that atmospheric response. One of the signs that the atmosphere is responding to El Niño’s warmer sea surface temperatures is a westerly wind anomaly near the surface. Usually, surface winds along the equator—the trade winds—blow from the east to the west (“easterly” winds). That easterly flow helps keep warm surface waters piled up in the western side of the Pacific.
When these easterly winds relax, or even turn westerly (blowing from west to east), they often allow some of that warm surface water to move back toward the central or eastern Pacific *. The westerly wind burst during March, show in the top part of the image below, was the strongest since 1997, lasting 9 days**.
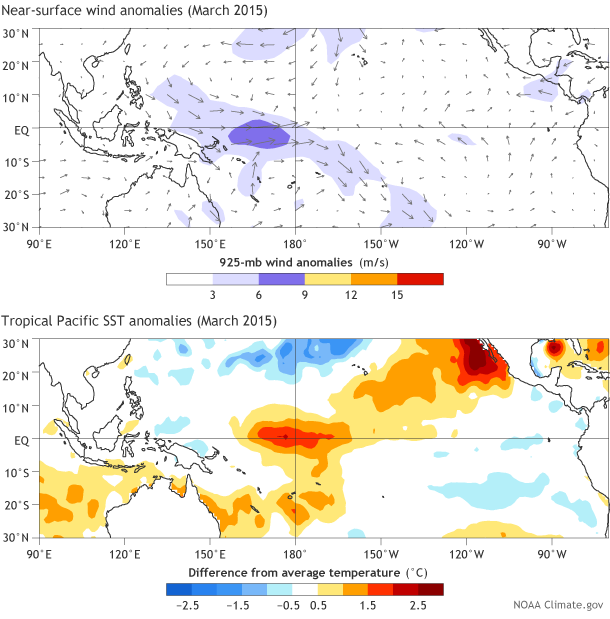
Wind (upper) and sea surface temperature (lower) departures from average in the tropical Pacific for March 2015. Purple shading indicates the location of the westerly wind burst. NOAA Climate.gov figure by Fiona Martin, based on Climate Prediction Center data.
Another hallmark of El Niño conditions is more rain than average in the central Pacific, and less rain over Indonesia. Based on measurements of the amount of longwave radiation escaping from Earth’s atmosphere—an indicator of clouds, which block longwave radiation coming from the surface—this classic El Niño rainfall signal became much clearer during March (see image below).
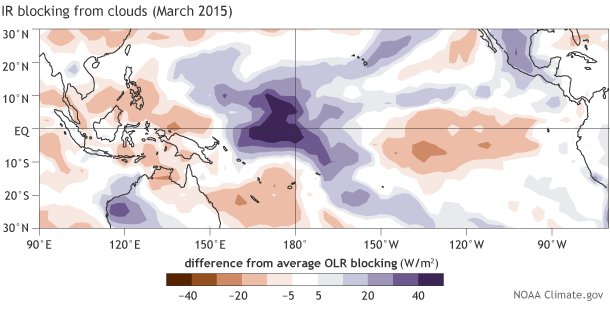
Blocking of outgoing longwave radiation (OLR) during March 2015. Purple shading indicates greater-than-average absorption of surface OLR (less OLR exiting the top of the atmosphere), showing areas where more clouds than average were present. NOAA Climate.gov image by Fiona Martin, based on CPC data.
More evidence that we’re seeing the weakened Walker circulation characteristic of an El Niño response is given by the March values of the Southern Oscillation Index (-0.7) and Equatorial Southern Oscillation Index (-0.9). These negative values tell us that the consistent rising motion that occurs in the atmosphere over the far western Pacific is reduced (higher-than-average surface pressure), and the connected sinking motion over the eastern Pacific is also reduced (lower-than-average surface pressure).
So that’s where we are…where are we going?
Forecasters give an approximately 70% chance that the surface temperature anomaly in the Niño3.4 region will remain above the El Niño threshold through the summer, and a greater than 60% chance that it will last through the fall. Implicit in this forecast is the expectation that the atmospheric coupling we’ve seen so far will continue. On what are we basing this forecast?
For the short term, there is a substantial supply of warmer-than-average subsurface waters in the equatorial Pacific, in the form of a strong downwelling Kelvin wave. This source of warmth, which increased during March, is likely to help keep surface temperatures above average for the next couple of months.
The strengthened atmospheric response that I described above is also a source of confidence for the forecasters, since it feeds back into the ocean – the classic “coupling” of ENSO or Bjerknes Feedback.
Most of the dynamical models are predicting continued equatorial Pacific surface temperature anomalies above +0.5°, also (see graph below). With the exception of one model, the forecasts are closely grouped, indicating they are fairly confident in the forecast.
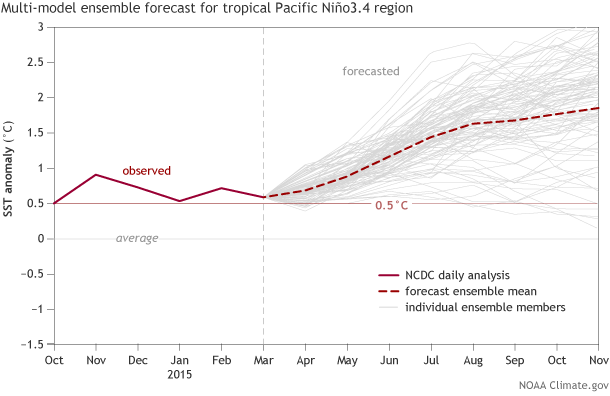
Forecast from the North American Multi-Model Ensemble (NMME) for sea surface temperature in the Nino3.4 region. NOAA Climate.gov figure by Fiona Martin, from CPC data. (Updated @ 2:30 Eastern time. The minus sign for -0.5°C was shifted up to the positive 0.5 value on the first version of this graph. It has been corrected.)
What are some sources of caution?
As you may recall, in spring 2014 the dynamical climate models were also pretty sure we were headed for a solid El Niño in the second half of 2014, but it did not materialize. We don’t know exactly what caused the overestimate from last year, which makes us treat the models’ current forecasts with some caution. Also, the models historically have a harder time making successful forecasts during the spring (the “spring predictability barrier.”) The statistical models, again similar to last year, are predicting lower ONI than the dynamical models, but they are also subject to the spring barrier.
Also similar to this time last year is the presence of a substantial downwelling Kelvin wave, and strong westerly winds. There are some differences, though, especially in this year’s wind anomaly, which was a little stronger, occurred a little later, and extended a little further east.
If the conditions were exactly the same as last year, our forecast probabilities might be less confident. However, conditions are not the same as this time last year. The Oceanic Niño Index (ONI) for January-March 2015 is more than 1°C warmer than for the same period in 2014, meaning we are starting off from a warmer base state than last year. It’s important to note that this doesn’t necessarily translate to a warmer outcome later this year, though.
What’s the bottom line?
As Michelle discussed in her recent post, it’s way too early to know with 100% confidence if we will see a strong event, or even if El Niño will continue into this coming winter—the time of year when ENSO exerts its greatest influence on global precipitation and temperature patterns. The atmospheric coupling would need to continue, especially the persistence of westerly wind anomalies, which we did not see last year.
However, the combination of current conditions with model forecasts leads us to giving a 60-70% chance that El Niño will continue through the summer and into the fall.
* We call them westerly wind anomalies when the winds are “less easterly” than average, even if they are still easterly on the whole.
** Based on analysis done by Phil Klotzbach of Colorado State University, focused on the region 5S-5N, 155E-180. The westerly wind burst exceeded 5 m/s from the daily average from March 4-12 (nine days), peaking at 7.4 m/s on March 8 in this region. This is the longest period that a westerly wind burst has existed since 1997 in that region, as well as the strongest magnitude for any given day since 1997.
Comments
forecasting
RE: forecasting
Central Pacific El Nino this year?
RE: Central Pacific El Nino this year?
Yes, so far the largest SST anomalies are in the central Pacific, near the dateline (and represented approximately by the Nino4 SST anomaly), rather than in the more typical location in the east-central part of the basin (represented more by the Nino3.4 or even Nino3 SST anomaly). Nino4 has had larger anomaies than Nino3.4 for many months already, and this feature becomes even more pronounced when we consider that the year-to-year variability in Nino4 is smaller than that in Nino3.4--that is, an anomaly of, say, +0.9C is less commonly observed in Nino4 than in Nino3.4 or Nino3 for any given season. However, although the event is shaping up to be a central Pacific event so far, it may not necessarily remain that way over the coming months. Most dynamical models predict a more typical SST anomaly pattern to emerge as the event matures from early northern fall to winter 2015-16. Of course they may be wrong, especially since today's models' ability to forecast El Nino type (e.g. Modoki vs. canonical El Nino) is quite limited.
el niño climatic phenomen
Mark's "Forecasting" comments
re: El Nino and the Pacific Northwest U.S.
RE: re: El Nino and the Pacific Northwest U.S.
Seriously, politics aside, if we do have El Nino going into next northern winter, especially if it is at least moderate strength, it would typically tend to encourage dryer than average conditions in the Pacific Northwest and, with considerable uncertainty, wetter than average conditions in southern California--especially in the later winter. But these are only expected tendencies and there are no guarantees. If southern California does get above average rainfall it would be very much welcomed unless it is too far above average, and comes in the form of just a few intense storms that do more damage than good. First, we must get this El Nino to actually happen. We are still in the spring barrier and the probabilities are not yet 80% or more. Many dynamical models do predict an enduring event, likely based to some extent on the recent buildup of anomalous subsurface heat in the central and eastern tropical Pacific.
RE: RE: re: El Nino and the Pacific Northwest U.S.
RE: RE: RE: re: El Nino and the Pacific Northwest U.S.
I agree with you about the messages provided by some (maybe many) media outets. Instead of sticking to the goal of informing or educating the readership, they seem to be looking for an attention-getting, emotionally provocative and stimulating newspiece. They have learned that more definitive and dramatic stories bring in larger returns than acccurate and informative ones, and know that NOW is always the best time to go for those returns. It is partly the general public's fault that this is the way it is, because many people are looking for something intense or extreme, and need excitement more than detailed information. For people interested in the raw facts and numbers, as you would be, some of the news articles include them faithfully along with the possibly overly dramatized descriptions or interpretations. I have developed a nose for detecting when the statements do not cleanly reflect the facts and data. In the case of the El Nino forecasts, not only do some media outlets exaggerate the prospects for a strong event (both for this year and last year, but especially last year), but some scientists looking to move up the ladder faster may take advantage of the media's bias toward extremes and present a bold and extreme forecast (perhaps from just one model; it is not good to rely on a single model) in order to get their visibility enhanced rapidly, hoping the forecast will verify and knowing that if it doesn't, people will forget by that time but still remember their name. So we have the potential for two different groups to be motivated by similar factors (increasing their visibility and/or income), neither helping to disseminate the forecast information in an accurate and balanced manner. For those wanting to learn the truth more than read a stimulating and non-boring story, the best strategy is to read several articles, not just one or two, and to look for the objective numerical information (e.g., probabilities for El Nino given by forecast producing centers) and piece together a cluster of factual material without words such as "disaster" or "devastating" coloring the information or its interpretation. Even though you are absolutely correct in saying it is too early to know beyond reasonable doubt that El Nino will occur this coming fall and winter (due to the spring barrier), there will be stories already (now) about the "GOOD CHANCE" for El Nino, with the possibility of a strong one having devastating impacts in the U.S. and abroad. We have to live with these articles out there, and learn which writers give a more even-handed presentation vs. which give one with an attention-getting, emotional spin that make us think "Oh, come on, let's get real". We have to compensate for this in our minds to come up with an appropriately adjusted understanding of the truth.
El niño in Nicaragua
El Nino
Arizona Rainforest
Cheap goods
Comments have been disabled on this article