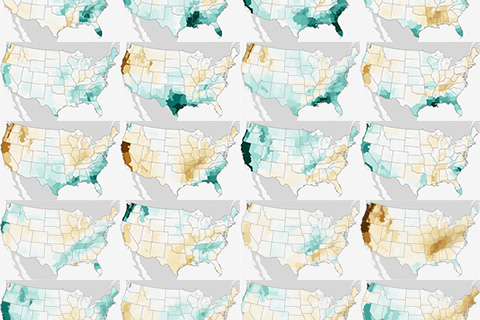
(UPDATED) Winter precipitation across the contiguous United States during every El Niño since 1950.
Above-average rainfall this past spring in Morton, Illinois, the so-called “pumpkin capital of the world,” is to blame for a pumpkin shortage this fall.
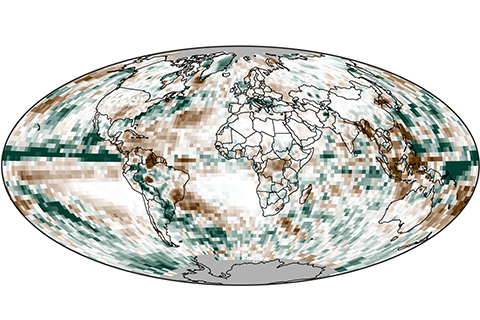
In 2014, precipitation over land was generally below average, while precipitation over the oceans was above average.
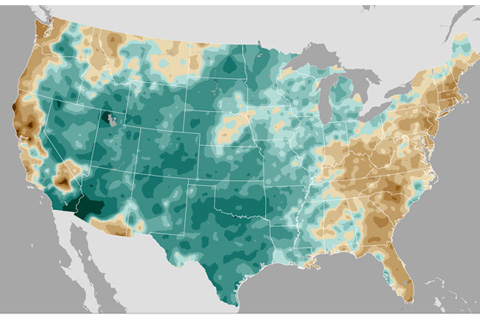
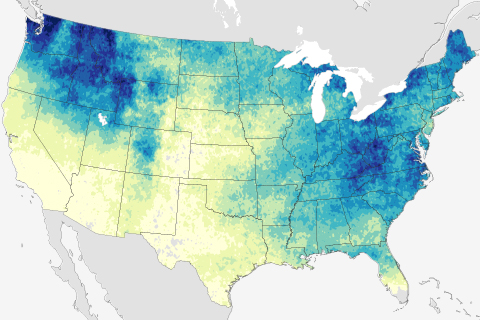
The nationwide average precipitation was the highest ever recorded in 121 years. Devastating floods ended a multi-year drought in the Southern Plains.
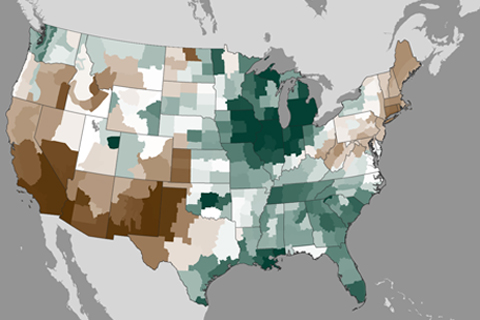
This pair of maps shows whether your state tends to have wet, dry, or average springs during El Niño, and how often the wet or dry pattern occurred during the last 10 El Niño years.
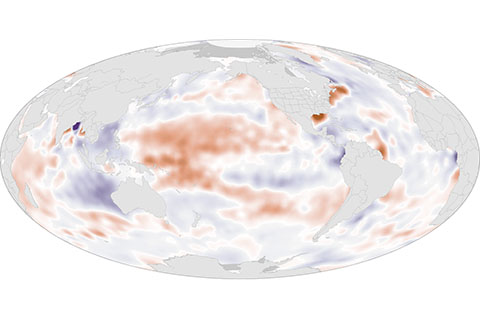
Across the globe, changes in salinity over time generally match changes in precipitation: places where rainfall declines become saltier, while places where rainfall increases become fresher. Where did saltiness change over the past decade?
According to the 2009 National Climate Assessment, heavy downpours have increased in frequency and intensity during the last 50 years. Models predict that downpours will become still more more frequent and intense as greenhouse gas emissions and the planet’s temperature continue to rise.
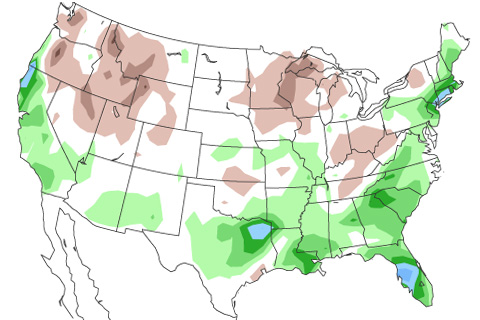
April showers and cool temperatures brought drought relief to many areas across the United States, but conditions worsened in the Southwest.
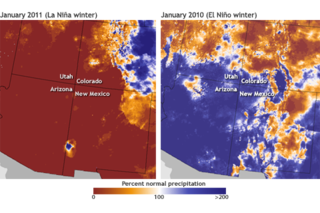
Influence of El Niño and La Niña on Southwest Rainfall
February 11, 2011
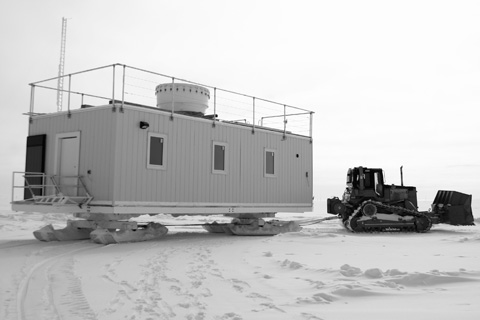
At the highest point atop the Greenland Ice Sheet, Matthew Shupe and his colleagues are installing a suite of climate and weather instruments. Their goal is to better understand the role of clouds in the rapid warming observed across the Arctic region.