Climate Variability: North Atlantic Oscillation
Late in the 18th century, a missionary who had traveled back and forth across the Atlantic Ocean for several years noted that mild winter conditions in Greenland often coincided with severe winter conditions in Denmark, and vice versa. The severe-versus-mild phenomenon he described is now recognized as an impact of the North Atlantic Oscillation or NAO.
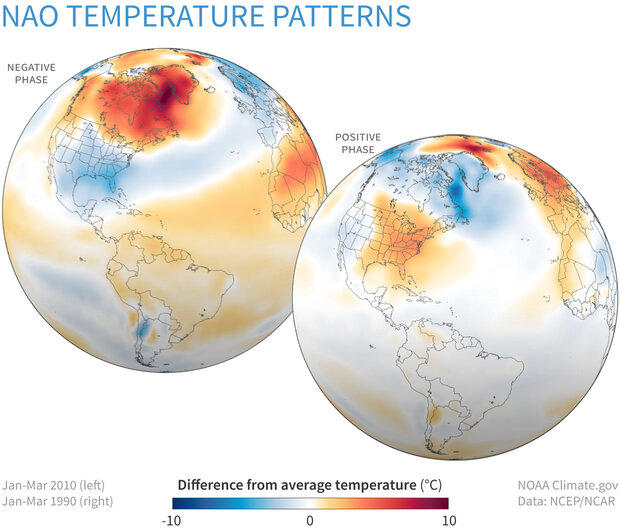
Late winter temperatures compared to the 1981-2010 average when the North Atlantic Oscillation (NAO) was strongly negative (top, Jan-March 2010) and when it was strongly positive (bottom, January-March 1990). Winters are often cooler than average across the mid-latitudes when the NAO is negative, and warmer than average when it is positive. NOAA Climate.gov image, based on data from the Physical Sciences Lab.
Air pressure over two regions drive this oscillation:
- The high latitudes of the North Atlantic Ocean near Greenland and Iceland generally experience lower air pressure than surrounding regions. This zone of low pressure is called the sub-polar low, or sometimes the Icelandic Low.
- Farther to the south, air pressure over the central North Atlantic Ocean is generally higher than surrounding regions. This atmospheric feature is called the subtropical high, or the Azores High.
The NAO is in a positive phase when both the sub-polar low and the subtropical high are stronger than average. During positive NAO phases, the increased difference in pressure between the two regions results in a stronger Atlantic jet stream and a northward shift of the storm track. Consequently, northern Europe experiences increased storminess and precipitation, and warmer-than-average temperatures that are associated with the air masses that arrive from lower latitudes. At the same time, southern Europe experiences decreased storminess and below-average precipitation. In eastern North America, the positive phase of the NAO generally brings higher air pressure, a condition associated with fewer cold-air outbreaks and decreased storminess.
The NAO is in a negative phase when both the sub-polar low and the subtropical high are weaker than average. During negative NAO phases, the Atlantic jet stream and storm track have a more west-to-east orientation, and this brings decreased storminess, below-average precipitation, and lower-than-average temperatures to northern Europe. Conversely, southern Europe experiences increased storminess, above-average precipitation, and warmer-than-average temperatures. In eastern North America, the negative phase of NAO generally brings lower air pressure, a condition associated with stronger cold-air outbreaks and increased storminess.
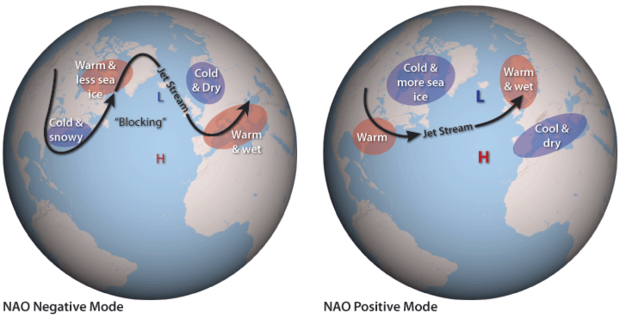
On average, the surface pressure near Iceland is relatively low (L), while the pressure near the Azores Island is relatively high (H). During a negative phase (left), this pressure difference weakens. During a positive phase (right), the difference becomes even stronger than usual. The variation in pressure patterns influences the strength and location of the jet stream and the path of storms across the North Atlantic. Schematic adapted from AIRMAP by Ned Gardiner and David Herring, NOAA.
The North Atlantic Oscillation is often strongly correlated with the Arctic Oscillation, which describes hemisphere-wide shifts in atmospheric pressure between the Arctic and the mid-latitudes of both the North Pacific and North Atlantic. In fact, atmospheric scientists continue to debate whether the two are separate phenomena or whether the North Atlantic Oscillation is simply the Atlantic half of the Arctic Oscillation. Regardless, the NAO is the most prominent pattern of climate variability in the mid and high Northern latitudes, and it has a strong influence on weather over northeastern North America, Greenland, and Europe.
Conditions associated with the two phases of the NAO directly affect human demand for energy, quality of crop yields, and productivity of fisheries. Unlike like the El Niño-Southern Oscillation, the North Atlantic Oscillation is not currently predictable more than a week or two in advance.
Data
A record of NAO phases for 1950 through the present is available from NOAA's Climate Prediction Center.
References
North Atlantic Oscillation page at Lamont-Doherty Earth Institute, Columbia University, by Ian Bell and Martin Visbeck. Accessed December 8, 2023.
North Atlantic Oscillation, NOAA's Climate Prediction Center. Accessed December 8, 2023.
Wallace, J. M., and D. S. Gutzler, 1981: Teleconnections in the geopotential height field during the Northern Hemisphere Winter. Mon. Wea. Rev., 109, 784-812.