2013 State of the Climate: Sea surface temperature
Why It Matters
Conditions in 2013
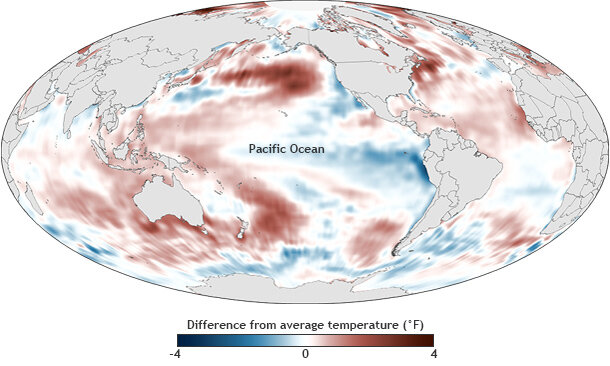
Sea surface temperature in 2013 compared to the 1981-2010 average. The dark red and blue areas reveal areas of the global ocean that were up to 4º Fahrenheit warmer or cooler than average. Map by Dan Pisut, based on NOAA OISST data. Adapted from Figure 3.1(a), in State of the Climate in 2013.
The globally averaged sea surface temperature in 2013 was among the 10 highest on record, with the North Pacific reaching an historic high temperature. ENSO-neutral conditions and a negative Pacific Decadal Oscillation pattern had the largest impacts on global sea surface temperature in 2013.
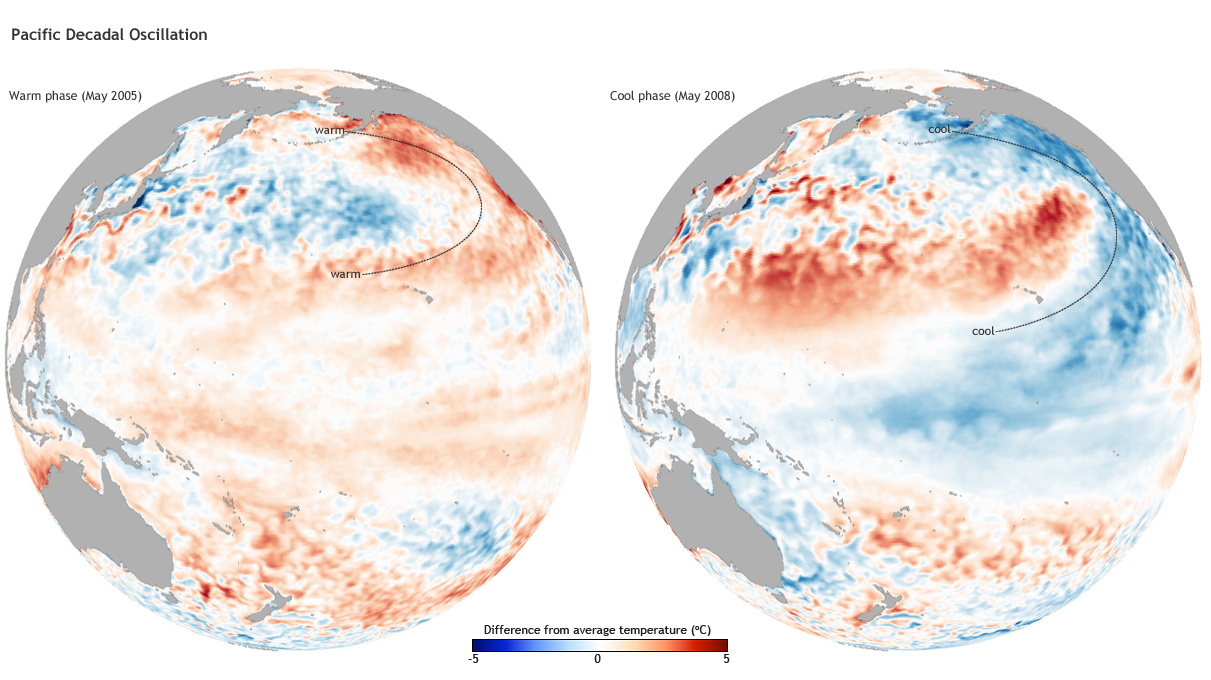
Typically, La Niña has a cooling influence on annual average sea surface temperatures, and El Niño has a warming influence. Unlike 2011 and 2012, when La Niña conditions were present, 2013 saw neutral El Niño-Southern Oscillation conditions prevail. The year was also characterized by a negative Pacific Decadal Oscillation pattern in the North Pacific. The classic signal of a negative PDO phase is a horseshoe-shaped area of cool water in the eastern North Pacific that surrounds a pocket of warm water in the central North Pacific.
Substantial warming south of the Bering Strait, Gulf of Alaska, and northeast Pacific compared to last year appeared to be largely forced by a persistent high-pressure system in the region that altered the atmospheric flow pattern. As a result, the westerly winds in the North Pacific weakened substantially, reducing the rate of evaporation and decreasing latent heat loss from the ocean, which further reinforced warm conditions.
Change Over Time
Annual sea surface temperature compared to the 1981-2010 average from a variety of sources. Despite year to year variability, all the years in the past decade have been warmer than average. Adapted from from Figure 2.1 of State of the Climate in 2013.
Natural patterns such as El Niño, La Niña, and the Pacific Decadal Oscillation, which influence the climate on a year-to-year or decade-to-decade basis, have occurred against a backdrop of warming that has been occurring over the long term. From 1970-1999, global sea surface temperature rose at an average rate between 0.06º and 0.11º Celsius per decade (depending on the data source). There has been little further trend in ocean surface temperature since 2000 (though ocean heat content and sea level continue to rise), consistent with the prevalence of La Niña-like conditions across the tropical Pacific in recent years.
Reference
Xue, Y., Z. Hu, A. Kumar, V. Banzon, T. M. Smith, and N. A. Rayner, 2014: [Global Oceans] Sea surface temperatures [in “State of the Climate in 2013”]. Bulletin of the American Meteorological Society (BAMS), S51-S54.