2012 State of the Climate: Sea Surface Temperature
Sea surface temperature—the average temperature of water at the surface of the global ocean—is a key indicator of the ocean's status. Because the ocean is constantly interacting with the atmosphere, changes in sea surface temperature can have profound effects on other aspects of Earth's climate. Over time, as oceans absorb more heat from the warming atmosphere, sea surface temperatures will increase and ocean circulation patterns that transport water around the globe will change. Rising sea surface temperatures can increase the destructive potential of tropical cyclones and hurricanes, and alter sensitive marine ecosystems such as coral reefs.
Conditions in 2012
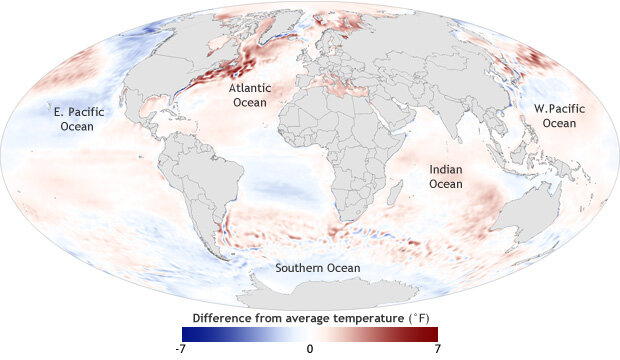
Sea surface temperature in 2012 compared to the 1981-2010 average, based on data from NOAA National Climatic Data Center. The dark red and blue areas reveal areas of the global ocean that were up to 7º Fahrenheit warmer or cooler than average.
Four independent datasets indicate that the globally averaged sea surface temperature for 2012 was among the 11 warmest on record. The most unusual warmth appeared north of the Gulf Stream in the North Atlantic, where sea surface temperatures were more than 1.5º Celsius warmer (3º Fahrenheit) than average.
On a yearly basis, the natural swings in ocean temperature accompanying El Niño and La Niña events have the single largest influence on global average sea surface temperature. Whereas 2011 was marked by a double-dip La Niña event, both El Niño and La Niña conditions were brief and fleeting in 2012.
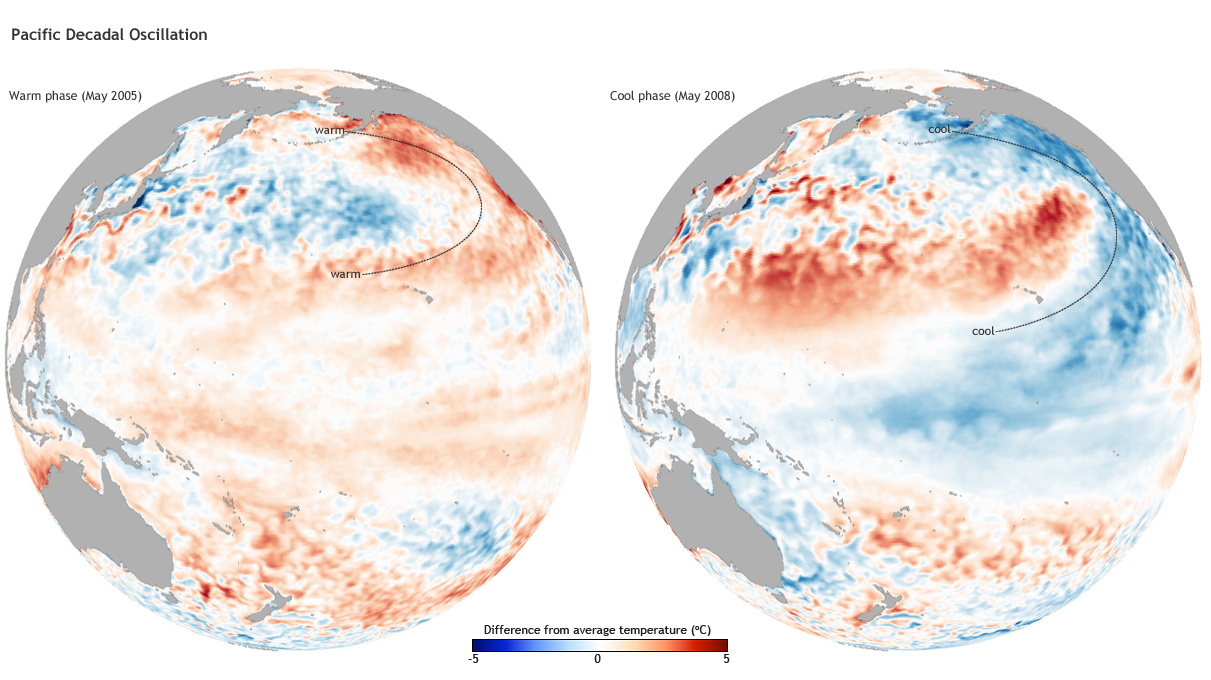
The year began with La Niña conditions in the tropical Pacific and a cool (negative) phase of the Pacific Decadal Oscillation (PDO) pattern in the North Pacific. The classic signal of a negative PDO phase is a horseshoe-shaped area of cool water in the eastern North Pacific that surrounds a pocket of warm water in the central North Pacific. In the spring, La Niña began to fade, and El Niño-like conditions marked by warmer waters in the central-eastern Pacific emerged during the summer. However, those conditions were short-lived, and by fall, temperatures in the eastern tropical Pacific had returned to near-normal.
Change Over Time
Natural patterns such as El Niño, La Niña, and the Pacific Decadal Oscillation, which influence the climate on a year-to-year or decade-to-decade basis, occur against a backdrop of warming that has been occurring over the longer term.
From 1970-1999, global sea surface temperature rose at an average rate of 0.06 to 0.11º Celsius per decade. The rate decreased from 2000-2012 due to a prevalence of La Niña-like conditions. From 2011-2012, as a weak La Niña transitioned to more neutral conditions, average sea surface temperature for the global ocean warmed by about 0.1º Celsius.
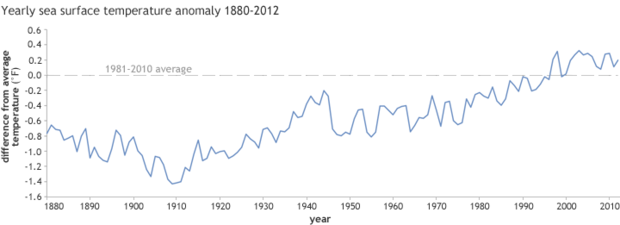
Difference from average temperature since 1880, based on the 1981-2010 average. Despite year to year variability, all the years in the past decade have been warmer than average. Reproduced from Plate e in Figure 2.1 of the State of the Climate in 2012 report (S11), using only the NOAA-NCDC data series for simplicity.
Reference
Xue, Y., Z. Hu, A. Kumar, V. Banzon, T. M. Smith, and N. A. Rayner, 2013: [Global Oceans] Sea surface temperatures [in “State of the Climate in 2012”]. Bulletin of the American Meteorological Society (BAMS), S47-S50.