2013 State of the Climate: Carbon dioxide tops 400 ppm
On May 9, 2013, the daily average concentration of carbon dioxide (CO2) in the atmosphere surpassed 400 parts per million (ppm) for the first time at the Mauna Loa Observatory in Hawaii, where the modern record of observations began back in 1958. Other Northern Hemisphere sites also reported CO2 concentrations exceeding 400 ppm in 2013. By summer, the high concentrations at these sites had dropped as vegetation began taking up carbon dioxide for photosynthesis.
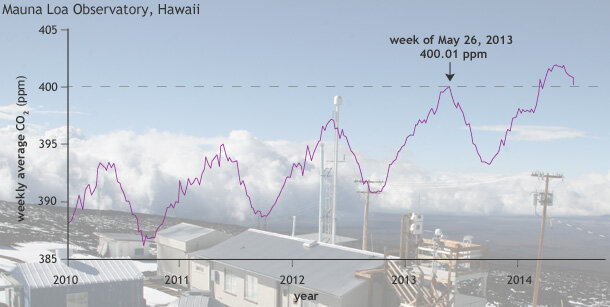
Weekly average concentration of carbon dioxide at Mauna Loa between 2010 and early 2014. Graph by NOAA Climate.gov, based on data provided by NOAA ESRL. Mauna Loa photo by Mary Miller, Exploratorium.
Though the 400 ppm level is only a symbolic benchmark for carbon dioxide concentrations, it should be noted that ice core records show CO2 levels never exceeded 300 ppm during the last 800,000 years until the early 20th century. Now, having exceeded 400 ppm, we are in uncharted territory.
Atmospheric carbon dioxide concentrations in parts per million for the past 800,000 years, with the 2013 annual average concentration as a dashed line. The peaks and valleys in carbon dioxide levels follow the coming and going of ice ages (low CO2) and warmer interglacials (higher CO2). Graph by NOAA Climate.gov, based on EPICA Dome C data (Lüthi, D., et al., 2008) provided by NOAA NCDC Paleoclimatology Program.
Before the Industrial Revolution began in the mid-1700s, the concentration of carbon dioxide was about 280 ppm. Since then, the burning of fossil fuels and other human-related activities have increased the amount of CO2 in the atmosphere by more than 40 percent. About half of the CO2 emitted to the atmosphere is taken up by vegetation, soils and oceans; the other half remains in the atmosphere.
This “extra” CO2 traps an additional 1.88 watts of energy per square meter of the Earth’s surface, about 1 percent of the Sun’s energy that reaches the surface. That may not sound like much, but across the Earth’s surface (510 million square kilometers) that extra CO2 traps 23 billion megawatts of energy every day, about the same amount of energy that was produced in the USA during all of 2013.
When measurements first began at Mauna Loa, the CO2 concentration already stood at about 315 ppm and was increasing at a rate of around 0.7 ppm each year. Fast forward five decades to 2013 and much has changed. The world’s population has more than doubled, and over the past decade, the average rate of increase in CO2 concentration has tripled to about 2.1 ppm per year. In 2013 the global average concentration was 2.8 ppm higher than in 2012, an increase that was 25 percent greater than the annual average increase observed during the previous decade.
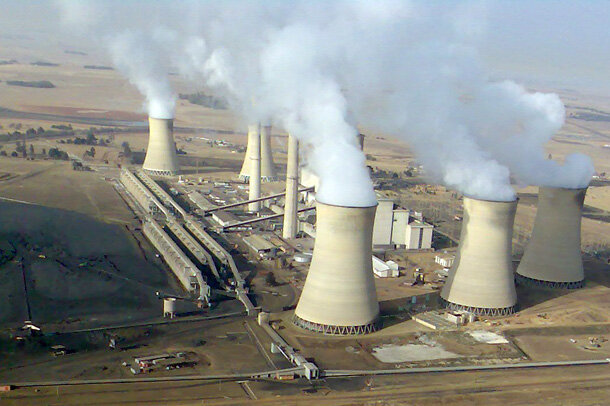
Aerial photo of coal-fired power station in South Africa. By Gerhard Roux, (CC-BY-SA-3.0-2.5-2.0-1.0), via Wikimedia Commons.
Every year, human activities produce more carbon dioxide than natural processes can absorb. That means the net amount of atmospheric carbon dioxide never decreases, and so the annual build-up of CO2 will keep accelerating as the world’s population continues to burn more and more fossil fuels. The annual average carbon dioxide concentration for the globe in 2013 stood at 395.3 ppm—a 25 percent increase compared to conditions at the start of the Mauna Loa record*. Scientists expect the annual global average will reach the 400 ppm threshold within several years.
[*Correction: Original sentence stated the increase was 27 percent more than pre-industrial. The increase is more than 40 percent compared to the pre-industrial, and 25 percent compared to levels when monitoring began at Mauna Loa.]
References
Dlugokencky, E.J., B.D. Hall, S.A. Montzka, G. Dutton, J. Muhle, and J.W. Elkins, 2014: [Atmospheric composition: Long-lived greenhouse gases] Global Climate [in “State of the Climate in 2013”]. Bulletin of the American Meteorological Society (BAMS), S33-S34.
U.S. Energy Information Administration. (2014). Monthly Energy Review: June 2014. [Table 1.1 (pdf)]. Accessed July 11, 2014.