How much will Earth warm if carbon dioxide doubles pre-industrial levels?
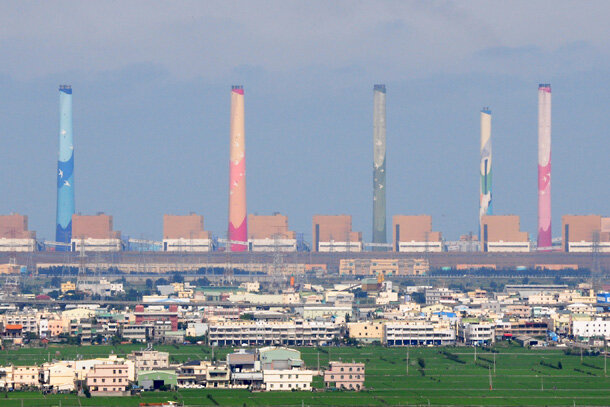
The towering smokestacks of Taichung Power Station, Taiwan—the world's largest coal-fired power plant. Photo from Wikimedia Commons.
Scientists say that doubling pre-industrial carbon dioxide levels will likely cause global average surface temperature to rise between 1.5° and 4.5° Celsius (2.7° to 8.1° Fahrenheit) compared to pre-industrial temperatures. (Current concentrations are about 1.4 times pre-industrial levels.) The full process could take hundreds of years—perhaps more than a thousand—to play out. Climate scientists call the full temperature rise from doubled carbon dioxide concentrations the equilibrium climate sensitivity.
To understand how sensitive the climate is to carbon dioxide on time frames of a century or less, scientists also study the transient climate sensitivity. They imagine that carbon dioxide will continue to increase at roughly the rate it has been, and then ask how much warming would be realized around the time when the concentration has doubled the preindustrial value. On this shorter time scale, it’s likely the planet will warm between 1° and 2.5°C (2°-4.5°F).
The difference between transient and equilibrium sensitivity comes from the fact that some parts of the Earth system—mountain glaciers, sea ice, precipitation—react within years or a few decades to a warming or cooling nudge. Others—including ice sheets, permafrost, and especially the deep ocean—respond sluggishly, sometimes taking centuries to overcome the inertia of their previous state.
“Sensitivity” is not a prediction of future temperatures
Estimates of climate sensitivity are not the same thing as model predictions of future temperatures. Sensitivity is a way to try to describe how the Earth system is capable of reacting if atmospheric carbon dioxide concentrations were to double, not a prediction of if or when that might happen. Future temperatures depend, obviously, on how sensitive the climate is to carbon dioxide and how much we actually emit.
Preliminary data for 2013 show that the annual average carbon dioxide concentration was around 396 parts per million (ppm). In recent years, carbon dioxide concentrations have been growing at a rate of 2 to 2.5 ppm each year. At those rates, it would take 60-80 years to double the pre-industrial level of 275 ppm. However, the rate of increase over the past half century has not been steady; it's been accelerating by about 0.5 ppm per year per decade. If the acceleration continues into the future, then doubled pre-industrial carbon dioxide concentrations will be reached in about 50 years.
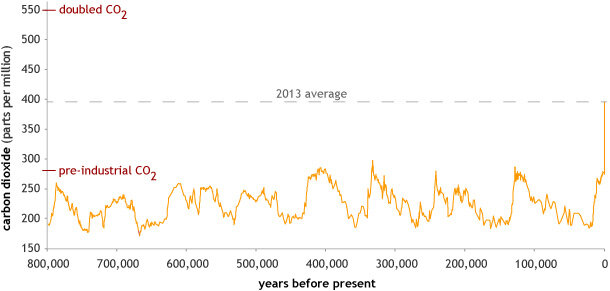
Atmospheric carbon dioxide concentrations in parts per million for the past 800,000 years, based on EPICA (ice core) data, with the 2013 annual average concentration of 396.48 ppm (dashed line) appended. The peaks and valleys in carbon dioxide levels follow the coming and going of ice ages (low levels) and warmer inter-glacials (higher levels). NOAA Climate.gov, based on EPICA Dome C data (Lüthi, D., et al., 2008) provided by NOAA NCDC Paleoclimatology Program.
Source of sensitivity estimates and their limitations
Broadly speaking, climate scientists infer sensitivity by looking at the correlation between global concentrations of carbon dioxide and global average surface temperature. They look at the correlation using modern observations, paleoclimate records like ice cores, and computer model experiments.
The modern observational record in itself is too short to provide a strong constraint on climate sensitivity; some studies suggest that values as large as 16°F cannot be ruled out based on the modern observational record alone. Paleoclimate studies are especially useful in constraining the high end of climate sensitivity, placing the value with some confidence at warming greater than 2°F, but less than 11°F. Most models predict equilibrium sensitivity in the range of 4-8°F, with a few higher than 9°.
The challenge in pinning down the exact relationship between a given carbon dioxide level and a specific temperature is that other factors influence temperature, too, including atmospheric dust and volcanic eruptions, amount of forests and other vegetation, and variations in incoming sunlight. Those factors have also varied over time, sometimes warming and sometimes cooling the climate. For example, during the industrial era, we have been pumping aerosol particle pollution into the air along with greenhouse gases. The particles reflect sunlight and interact with clouds in ways that cool climate, partially offsetting warming.
Changes in sensitivity estimates in recent decades
These simultaneous changes don’t mean it is impossible to know anything about the relationship between carbon dioxide and temperature; they do mean that it is hard to settle on a single, exact number. In fact, the likely range of 2.7°-8.1°F published in the recently released 5th Assessment report from the Intergovernmental Panel on Climate Change is the same as in their first report, published in 1990.
It's not quite true to say the estimates haven't budged since the first assessment, though. In 2007, for the 4th IPCC report, international scientists decided that enough evidence had come in to rule out equilibrium sensitivity lower than 4°F. So why did scientists involved in the latest IPCC report bump the lower bound of equilibrium sensitivity to carbon dioxide back down to near 3°?
One reason is that recent research suggests that cooling due to aerosols over the twentieth century has been less than previously estimated. If the cooling effect of aerosol pollution over the past century had been large, then sensitivity to carbon dioxide would also have been relatively large, in order to account for the observed warming trend. If aerosols have provided less cooling than previously thought, then sensitivity could also be somewhat smaller than previously thought.
A second reason for lowering the low-end of the range is that Earth's surface temperature during the 2000-2010 decade—while still the warmest decade on record—was relatively stable. The lack of additional surface warming in the past decade despite increasing carbon dioxide levels provided some additional support for somewhat lower sensitivity of global temperature to carbon dioxide increases.
As with all probability-based estimates, there’s what’s likely to happen and what is possible. Although the “long tails”—extremely low and extremely high values—of warming remain possible, climate experts think it is extremely unlikely that equilibrium warming from doubled carbon dioxide will be less than 2°F, and very unlikely that it will be more than 11°F.
Given the wide range of possible warming and the broad scope of potential impacts to natural resources, food and water supplies, and infrastructure, the key question we have to ask ourselves may not be "How certain are we of future change?" but instead, "How much risk of disruption are we willing to tolerate?"
References
Bindoff, N. L., P. A. Stott, K. M. AchutaRao, M. R. Allen, N. Gillett, D. Gutzler, K. Hansingo, G. Hegerl, Y. Hu, S. Jain, I. I. Mokhov, J. Overland, J. Perlwitz, R. Sebbari, and X. Zhang, 2013: Detection and Attribution of Climate Change: from Global to Regional. In: Climate Change 2013: The Physical Science Basis. Contribution of Working Group I to the Fifth Assessment Report of the Intergovernmental Panel on Climate Change [Stocker, T. F., D. Qin, G.-K. Plattner, M. Tignor, S. K. Allen, J. Boschung, A. Nauels, Y. Xia, V. Bex and P. M. Midgley (eds.)]. Cambridge University Press, Cambridge, United Kingdom and New York, NY, USA.
Collins, M., R. Knutti, J. M. Arblaster, J.-L. Dufresne, T. Fichefet, P. Friedlingstein, X. Gao, W. J. Gutowski, T. Johns, G. Krinner, M. Shongwe, C. Tebaldi, A. J. Weaver and M. Wehner, 2013: Long-term Climate Change: Projections, Commitments and Irreversibility. In: Climate Change 2013: The Physical Science Basis. Contribution of Working Group I to the Fifth Assessment Report of the Intergovernmental Panel on Climate Change [Stocker, T. F., D. Qin, G.-K. Plattner, M. Tignor, S. K. Allen, J. Boschung, A. Nauels, Y. Xia, V. Bex and P. M. Midgley (eds.)]. Cambridge University Press, Cambridge, United Kingdom and New York, NY, USA.
Held, I. M. (2013). Climate science: The cause of the pause. Nature, 501(7467), 318–319. doi:10.1038/501318a.
Jones and de Torres. (2013, Sept. 19). 25 years of the IPCC [infographic]. Nature, 501, p. 298-99.
Kosaka, Y., & Xie, S.-P. (2013). Recent global-warming hiatus tied to equatorial Pacific surface cooling. Nature, 501(7467), 403–407. doi:10.1038/nature12534.
Lüthi, D., M. Le Floch, B. Bereiter, T. Blunier, J.-M. Barnola, U. Siegenthaler, D. Raynaud, J. Jouzel, H. Fischer, K. Kawamura, and T.F. Stocker. (2008). High-resolution carbon dioxide concentration record 650,000-800,000 years before present. Nature, Vol. 453, pp. 379-382. doi:10.1038/nature06949.
Tans, P., and Keeling, R. (2013). Mauna Loa CO2 Annual Mean Data. NOAA/ESRL Global Greenhouse Gas Reference Network.