2012 State of the Climate: Arctic Sea Ice
Why it matters
Sea ice extent in the Arctic plays a critical role in the Earth system. Physically, its white surface reflects up to 80 percent of incoming sunlight during the long days of Northern Hemisphere summer, exerting a cooling influence on the climate. Plus, polar bears, walruses, and whales rely on the presence of sea ice to preserve their hunting, breeding, and migrating habits. Additionally, less ice means more Arctic shipping and exploration, with major implications for the world economy and national security.
Conditions in 2012
In 2012, summer minimum sea ice extent was recorded at 3.41 million square kilometers: the lowest of the satellite era, and 18 percent lower than in 2007, when the previous record of 4.17 million square kilometers was recorded.
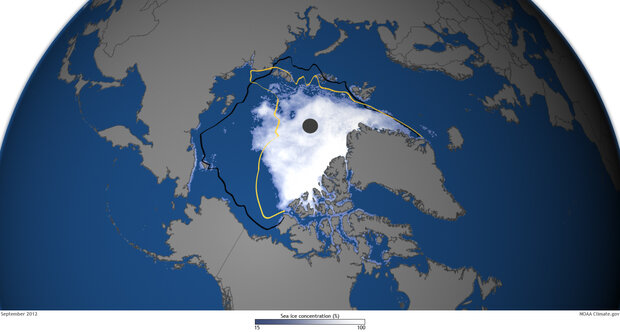
Map shows ice concentration on September 16, along with the extent of the previous record low (yellow line) and the mid-September median extent (black line).
The record-breaking melt season of 2012 started out at a sluggish pace. Around mid-April, sea ice extent was close to the 1979–2000 average for that time of year. However, soon after that the decline began to accelerate rapidly. By late August, ice extent had shrunk to 4.10 million square kilometers, which was smaller than the previous record low extent set in September 2007. Overall, 11.83 million square kilometers of ice was lost between the maximum and minimum extents. This was the largest seasonal decline in the satellite record.
Change Over Time
Overall, since satellite-based measurements began in the late 1970s, Arctic sea ice extent has decreased in all months and virtually all regions, with the exception of the Bering Sea during winter. The average melt rate in September is now -91,600 square kilometers per year or -13 percent per decade relative to the 1979-2000 average. Summer ice declines have been especially rapid since 2001.
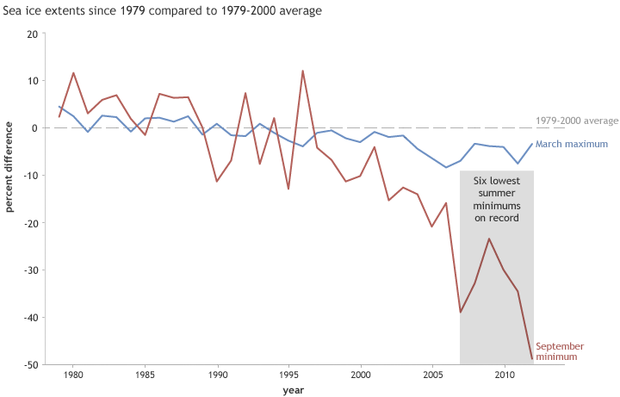
Percent difference in annual March maximum (red line) and September minimum (blue line) ice extent in the Arctic since 1979 compared to the 1979-2000 average (dashed line). Ice extent has decreased rapidly in the past decade. Graph adapted from Figure 5.20 in BAMS’ State of the Climate in 2012.
The 2012 minimum was 3.29 million square kilometers (49 percent) below the 1979–2000 average minimum of 6.71 million square kilometers. The last six years, 2007–2012, have had the six lowest minimum extents since satellite observations began.
References
Perovich, D.K., W. Meier, M. Tschudi, S. Gerland, and J. Richter-Menge, 2013: [The Arctic] Sea ice cover [in “State of the Climate in 2012”]. Bulletin of the American Meteorological Society (BAMS), S126-S127.
Related Links
State of the Climate: 2011 Arctic Sea Ice Minimum Arctic Sea Ice Getting Thinner, Younger