Arctic Sea Ice Getting Thinner, Younger
Note: A newer version of this animation, including maps through early November 2016, is available on Youtube. The most recent update on the age of Arctic sea ice is part of our coverage of the 2021 Arctic Report Card.
Animation of maps of sea ice age classification from 1987 through mid-August 2012. Ice class 1 means "first-year ice," which is ice that formed in the most recent winter and has yet to survive a summer. The oldest ice is ice that is more than 9 years old. Dark gray areas indicate open water or else coastal regions where the spatial resolution of the data is coarser than the land map. Climate.gov animation, based on data from NSIDC.
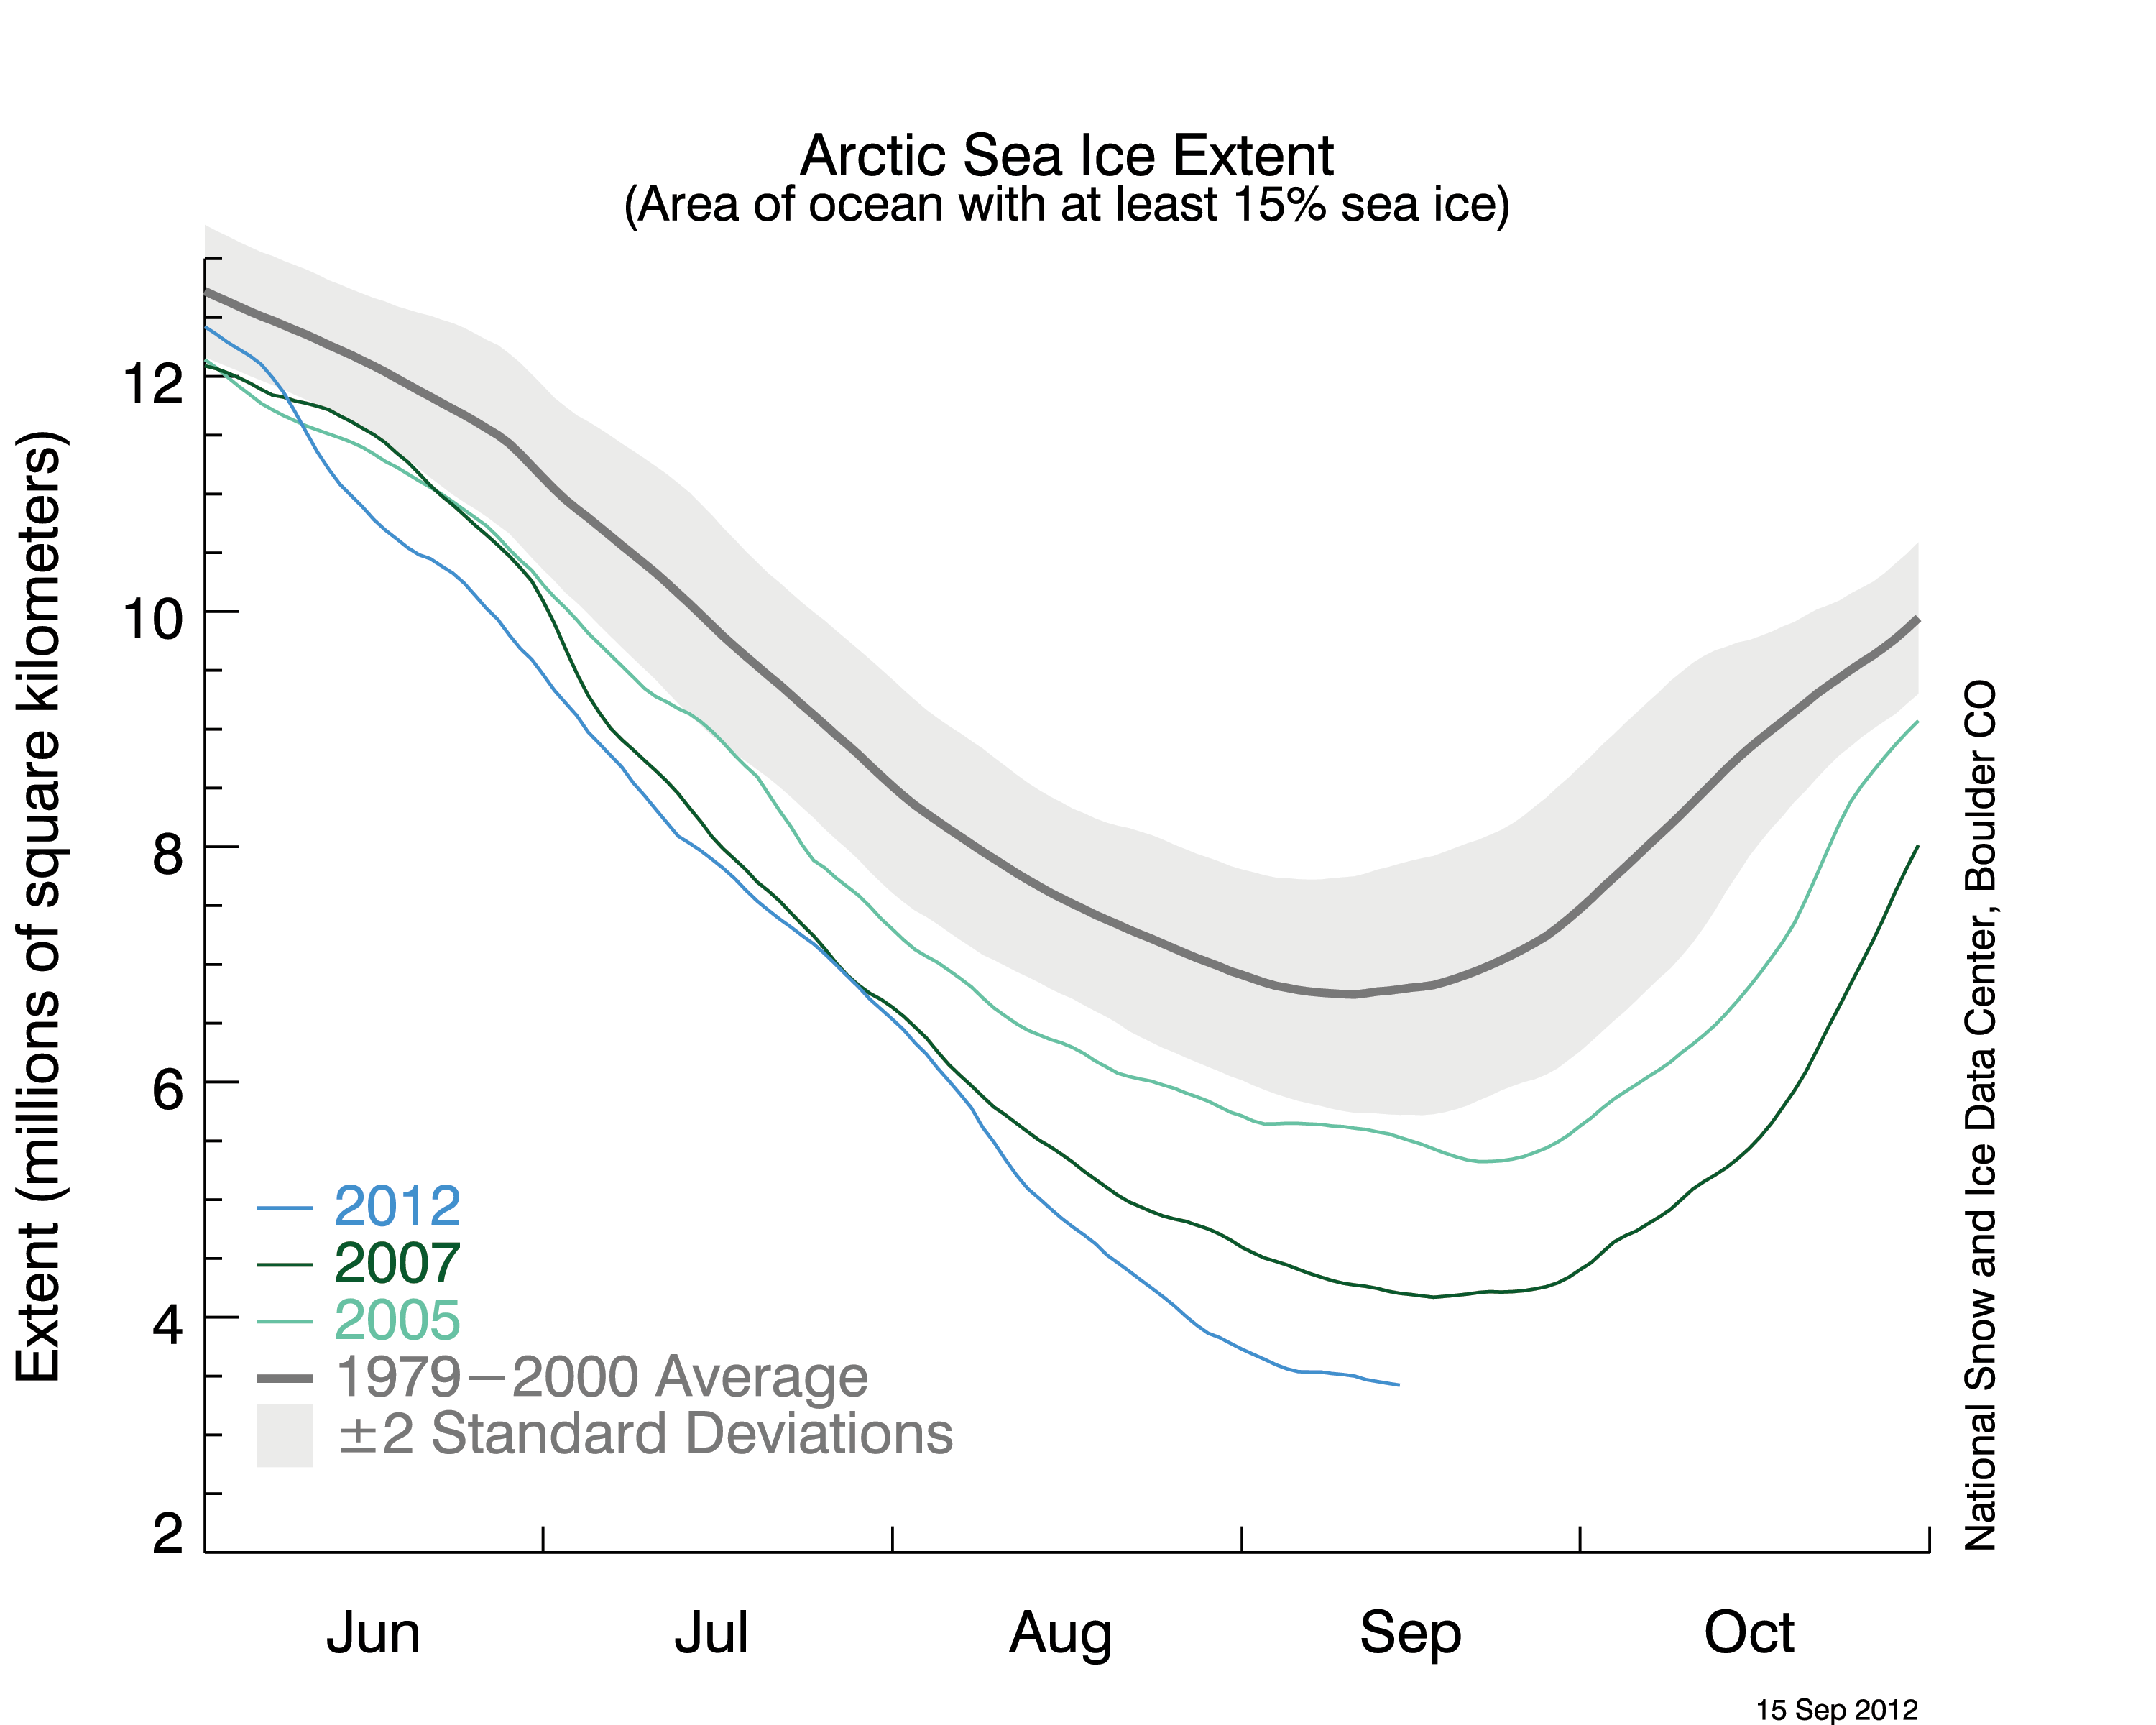
It’s been a dramatic year for Arctic sea ice. The beginning of the melt season was sluggish, but by late August, ice extent had shrunk to 1.58 million square miles (4.10 million square kilometers), which was smaller than the previous record low extent, set in September 2007 at the end of the melting season. By the time the melt season was over on September 16, 2012, ice extent had fallen to a new all-time record low: 1.32 million square miles (3.41 million square kilometers.)
Arctic sea ice extent averaged for September 2012 was the lowest in the satellite record, according to the monthly summary from the National Snow and Ice Data Center; the long-term trend in the September (summer) minimum ice extent is now -13% per decade. All six of the smallest September average ice extents in the satellite record have occurred in the last six years, part of the evidence of the decades-long trend in Arctic warming.
But surface area isn’t the only quality of the ice that is changing. Wind and ocean circulation patterns are conspiring with a warmer climate to reduce the amount of year-round (multi-year) ice, transforming the remaining ice into a younger, thinner version of its old self.
Animated graph of daily ice volume from 1979 through mid-August 2012. Volume is shown in thousands of cubic kilometers. Animation by climate.gov team, based on modeled ice volume data from the Polar Science Center at the University of Washington.
The Arctic Ocean is largely surrounded by land, which limits the ability of sea ice to drift southward into warmer waters. Some ice continually flows out of the Arctic through the Fram Strait east of Greenland, but this ice loss has historically been offset by ice growth in the Beaufort Gyre, where ice can last for years. But the Beaufort Gyre has been a less effective nursery for thickening ice in recent years; young ice is less likely to survive its trip through the warm, southern part of the gyre.
In contrast to multi-year ice, first-year ice—ice that formed only since the last melt season—is thinner, saltier, and much more prone to melt. Since the late 1980s, this young, melt-prone ice has come to dominate the Arctic sea ice pack. Ice that is more than nine years old now persists only as a sliver snaking its way along the Canadian Arctic islands and northern Greenland, and virtually no ice that old remains in the central Arctic.
Salt content and hardness play a part in multi-year ice’s resistance to melt, but the main characteristic that allows the ice to survive the melt season is thickness. Ice that survives multiple melt seasons in the Arctic can thicken up 4 meters (13 feet). So the loss of multi-year ice translates into an overall loss of Arctic sea ice volume.
The Polar Science Center at the University of Washington uses a model to calculate sea ice volume. Patterns and trends in ice volume are similar to patterns and trends in ice extent in some ways, but different in others (and not just because the two groups use a different baseline for their long-term average).
They are similar in that both sea ice extent and sea ice volume in 2012 were far below their long-term means. One difference between the patterns of surface extent and volume, however, is that measurements of sea ice extent show that, until 2012, no minimum extents matched the record low from the summer of 2007. But the Polar Science Center’s calculations of volume show that the summer of 2012 was not the only summer when volume fell below the 2007 value: sea ice volumes in the summers of 2010 and 2011 were also lower than 2007.
This difference is consistent with the loss of old, thick ice. While the presence of first or second year ice will boost ice extent (or area) in some years, it will add little to the volume because it is so young and thin. The latest volume figures currently available are from August 2012, and they show a new record low for that month.
The loss of thick, melt-resistant, multi-year ice can easily become a self-reinforcing process. When multi-year ice melts away—or when young ice fails to survive any melt seasons—the ice that remains in the Arctic will be predisposed to melt quickly during the following summer.
*To smooth out daily bumps in the data, NSIDC uses a five-day running average, and calculations of sea ice extent have been refined over the past several years.
For more information
National Snow and Ice Data Center. (2012, October 2). Poles apart: A record-breaking summer and winter.
NASA Earth Observatory. (2009, April 20) Sea ice. Accessed September 19, 2012.
Kennedy, C. (2012, July 10). State of the Climate in 2011: Arctic Sea Ice Minimum Extent. ClimateWatch Magazine.
National Snow and Ice Data Center. (2012, September 19) Arctic sea ice extent settles at record seasonal minimum. Accessed September 19, 2012.
Polar Science Center, University of Washington. Arctic Sea Ice Volume Anomaly, version 2. Accessed September 19, 2012.