Global warming, or just the weather?
NOAA's Thomas Peterson answers questions about the climate detective work behind a newly published collection of studies into several extreme events from 2012. Climate scientists describe this kind of analysis as event attribution: figuring out how much, if any, of a given event should be attributed to human-caused climate change and how much should be attributed to natural weather or climate variability.

Thomas Peterson, Principal Scientist at NOAA's National Climatic Data Center.
Throughout the collection, scientists talk about both 'global warming' and 'human-caused climate change.' What's the difference?
As the planet warms due to greenhouse gases, there are a lot of other changes going on in the climate system. So if you just look at warming, it's a lot more limiting than if you look at all the other changes that humans are causing as well—for example, increases in heavy precipitation.
Why is the question of whether human-caused climate change contributed to an extreme weather event so important to people, do you think?
For many people it's about planning for the future. The changes in climate that humans are causing are a continuing factor: we are going to see the planet continuing to warm as we go forward. If you can understand that human influence helped to cause an event, or make it more severe, then you can recognize that such events are likely going to become more frequent in the future. You're going to plan accordingly. If it's just natural variability—just an odd, rare event—then you may not need to prepare for having more of those in the future.
Is knowing that a type of extreme event will become more frequent the same thing as saying those events will become more predictable?
Not necessarily. In some circles, they lump extreme event attribution and prediction together as one 'grand challenge' because solving one part of it could help with the other part. If you could better predict extreme events, you would have a better understanding of the factors that influence them, and vice versa. If you understand the attribution of an extreme event, then—maybe—you could better predict those events it the future.
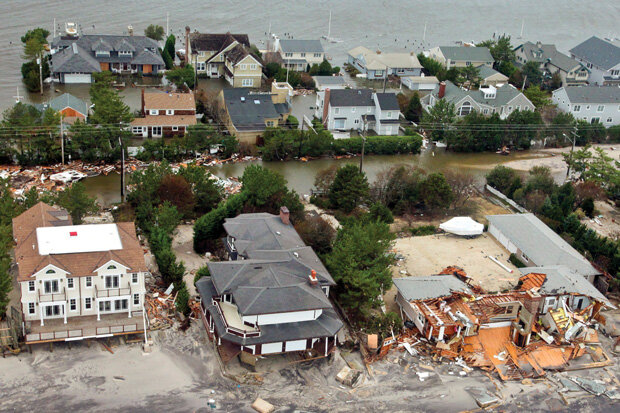
Breezy Point, New York, on November 14, 2012, in the wake of Hurricane Sandy. The massive storm surge was mostly due to Sandy's sprawling size and the fact that its path at landfall was directly on shore and during high tide. Still, scientists estimate that since 1950, global-warming-related sea level rise has doubled the region's probability for Sandy-scale events.
But yet, there are so many small scale features of the global atmosphere that impact, say, whether a hurricane hits New York City or not. We can discuss how much sea level rise from global warming impacted the flooding, but that doesn't necessarily help you predict whether a hurricane out in the Atlantic will hit New York City or not. So you might conclude that global warming has made something more likely without concluding that individual events should become more predictable.
The collection included 19 analyses of 12 events. How were the events chosen?
Mostly, it's the contributors who choose the events based on what interests them and what they think are answerable questions. One of the things we noticed is that scientists tended to analyze events that occurred in their area and that impacted them and their neighbors as opposed to an objective consideration of which events across the globe qualified as 'the most extreme.'
Sometimes, we go out and beat the bushes to find people studying an event we would really like to see in the report. For example, it actually took some effort to find someone already working on Hurricane Sandy who would be able to address some of the questions we were hoping to have answered.
Did you find any of the choices surprising?
One of the ones I find really fascinating is the analysis of a cold outbreak in the Netherlands, which was cold enough that they would have expected to have a multi-city ice-skating race on the canals in Holland. But they didn't have it because ice wasn't thick enough, and there was an analysis to find out if that was due to warming. They concluded that it wasn't due to warming, rather it was because they had too much snow on the ice, which insulated the ice so it could not grow thick enough to support the skaters. We have all heard the stories of Hans Brinker and the silver skates, so this is sort of right out of legends.
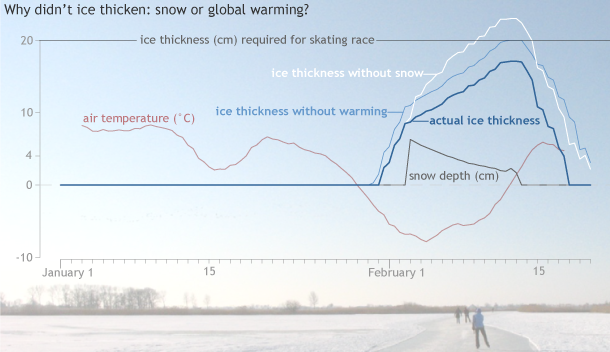
In late January 2013, temperatures in Holland (red line) dropped below freezing, and ice (dark blue line) began to thicken on the race course's canals. Snowfall (gray line) in the first week of February insulated the ice, slowing its growth. Models estimated that even without long-term climate warming, ice thickness would have been just under the safety threshold (light blue line). If only it hadn't snowed (white line), ice would likely have been thick enough for skaters to race. Graph adapted from Figure 3.2 in the report. Photo courtesy Hylke de Vries.
The collection includes more than one analysis of the same event. Do any of them disagree about the human contribution?
I didn't see any examples where one clearly said, "Yes, this was caused by human-induced changes," and another one said, "No, it was definitely not caused by human-induced changes." The Australian analyses of extremely heavy rain in early 2012 are perhaps the closest example. One paper looking at the heavy precipitation said it was clearly, dominantly just natural variability. The other paper said that human-induced climate change would have caused a small increase in heavy precipitation, but that this event was so far out on the tail, so much just an odd occurrence of events, that it was predominantly natural variability that caused it.
So, there is somewhat different wording, but they came to essentially the same conclusion.
But there have been cases where one analysis or group of scientists concluded an event had a significant human-caused influence and another analysis or group of scientists concluded there was little or no influence. What should people make of that?
Well, you've hit a touchy subject. It is a difficult question even for some scientists to understand. Some of it is due to exactly what metric one is looking at. Are you looking at how warm the temperature was, or are you looking at how often you could reach that particular temperature? Those are different metrics of change, and so exactly how you look at it does alter the answer.
One of the lessons I would take away from this is summarized in the piece on Hurricane Sandy. In that analysis they talked about the change since 1950. How for one place in 1950, the recurrence interval for an event like the flooding caused by Hurricane Sandy was something like 435 years, versus now it's more like 295 years. Instead of just taking those and saying this is exactly the fraction of how much the flood risk has changed, maybe you take away a sense that this is, as the authors state, something like a one-third to two-thirds more frequent occurrence now due to sea level rise.
That's part of what I am hoping people will understand. That very specific numbers that an individual study comes up with are valid for that study and that methodology, but the bottom line that you should pay attention to is whether that kind of event is becoming more likely or less likely.
Speaking of metrics, I noticed that several of the heat wave analyses defined the "extremeness" of the event in terms of "how many degrees the temperature was above average," with the baseline being recent decades, say 1970-2000. Why would scientists use that base period, rather than some point earlier in the century, before global warming had really started to influence the temperature record?
Well, often it is just a function of data availability and data analysis. To begin with, for these analyses you generally don't look at the actual, specific temperature at a station because another station that is 500 meters higher on a hill nearby would have a different reading. Instead, you look at anomalies, or how different the temperatures in an area were from some baseline period.
And generally what you do is choose the base period that optimizes the number of stations you can look at. If you wanted to choose a base period from say, 1880 to 1920, you're not going to have a lot of stations that are in operation now that would have had data back then to use.
But if you had used an earlier base period, instead of the 1970s to 2000, then what you'd see is that your temperature anomaly during the recent extreme event was higher.
Does that suggest that the estimates of the influence of global warming on those analyses is likely conservative?
Yes, in some cases. A heat wave that was a half a degree warmer than average when compared to recent decades could be a degree warmer than average when compared to an earlier time period. And the Hurricane Sandy case only compared the effect of sea-level rise from 1950 to the present. The change would be larger if they compared the effect of sea-level rise from 1900 to the present.
Of all the events that scientists chose to analyze, the ones that look for a human fingerprint in the record low Arctic sea ice extent in September 2012 might puzzle people. Is there still uncertainty that human-caused warming is the primary cause of Arctic sea ice loss?
There's still uncertainty about the speed with which Arctic sea ice will be melting in the future and when we will have an ice-free Arctic Ocean during the summer. We can see the long-term trends, and that's obviously related to climate change. But we also see some major dips, like in 2012, when you have record low event. So what they're trying to figure out is, even with the long-term trend, what caused that particular year to be extremely low. That's relevant if you are looking at projections in the future. If this record-low year was due solely to global warming, that would alter one's expectations of how quickly one should expect an ice-free Arctic Ocean.
So you're talking about the difference between the influence of human-caused climate change on a long-term trend versus its influence on a specific event?
Yes, there's attribution of change and attribution of events. For example, there was a paper published several years ago that looked at changes in heavy precipitation across the Northern Hemisphere, and it came to the conclusion that the observed increases in heavy precipitation was caused by human induced climate change. But the attribution is different when we are talking about a particular heavy rain event in a particular location or part of a country.
You've described how the conclusion of whether there was a human influence on an event can change based on whether you specifically ask "Did global warming make this event stronger?" versus "Did it make this event more likely?" With the conclusions so sensitive to how we frame the questions, how will scientists make real progress in understanding how human-caused climate change affects extreme weather?
Well part of the value of what we are going through at this time, using many different techniques and many different approaches, is that we are going to be seeing what seems to work the best, what pulls out the signal that we are most interested in, and what is the most reliable way to do this.
For example, one analysis of the heat wave used a "flow-analog" technique, where scientists look into the past and try to find years that had a similar atmospheric circulation pattern to the pattern during the extreme event. And then they compare the temperature during the extreme event not to every year in the past, but only to those years that had similar atmospheric circulation—a way to make sure you're comparing apples to apples when you ask how unusual the heat wave was.
And some people are able to use climate models that are run with no human-induced forcing, including increasing greenhouse gases, to compare with results run with current forcing, and be able to look at pre-industrial versus the current climate. Other analyses focus squarely on observations.
The fact that we may get somewhat different answers using different techniques is to be expected. We don't want all the answers to be exactly the same. We want people to use different models to come up with somewhat different results because this range allows us to put a fudge factor, or reasonable boundaries, on how literally we should interpret any specific assessment of an event.
If you have a range of results, you don't conclude that global warming and sea-level rise have changed the return frequency of a Sandy-level event from exactly 435 years to 295 years. Instead, you conclude that it is a change from a very rare event to a still rare, but more frequent event, and that's the general assessment of how global warming has influenced an event like Sandy.
If part of the value of having different analyses of the same event is to figure out which methods are most useful, do you think, as the collection's lead editor, that the current collection offer any guidance on that problem?
There are people working in this field that are definitely set on certain methodologies and feel that certain approaches are most fruitful. But I am not ready at this point to pass judgment on which were the best and which were not. There are some that I find really interesting, like two papers that were done with model runs on citizen science contributions.
The paper by David Rupp and colleagues on drought in the U.S. Central Plains is one where a team from University of Oxford and related institutions have a climate model that can be run on a personal computer. In order to look at extremes, you can't just run the model once and say, "OK, this is how extremes are changing," because extremes are rare events. You have to run the model hundreds and hundreds of times to produce enough events to study.
They don't have the resources to run the model that many times, but they've managed to get volunteers from around the world to allow them to run the models on personal computers, and just send results in. I think that's a wonderful contribution—people who are volunteering their own computer time to improve climate science.
*********
Explaining Extreme Events of 2012 from a Climate Perspective was published today as a supplement to the Bulletin of the American Meteorological Society. Peterson, the Principal Scientist at NOAA's National Climatic Data Center, was the report's lead editor.