Global sea ice in November: Black swans flock to both poles
If every swan you ever saw was white, you might think a black swan is impossible. That idea is the basis for what people in the world of commerce call a black swan event: a situation—such as the 2008 financial crisis—so rare that few people saw it coming. In the world of sea ice, November 2016 brought the kind of surprise that few sea ice scientists anticipated. Ice conditions were so unusual that Ted Scambos, the lead scientist at the National Snow and Ice Data Center, described them as a black swan event.
Really, really, really low
In early December, the National Snow and Ice Data Center (NSIDC) reported that both Arctic and Antarctic sea ice extents had dropped to record lows in November 2016. The surprise was more than just both hemispheres experiencing record-low extents. The extents were far outside the range of variability that we'd expect based on historical observations.
In its graphs of Arctic and Antarctic sea ice extent, NSIDC always includes a band of gray shading that shows the range of natural variability, which they define as ± two standard deviations. (Standard deviation is a statistical method of showing the spread of values scattered around the mean. One standard deviation above and below the mean includes roughly 68% of the values measured, two standard deviations on either side of the mean include roughly 95% of the values, and three standard deviations include 99.7% of the values.)
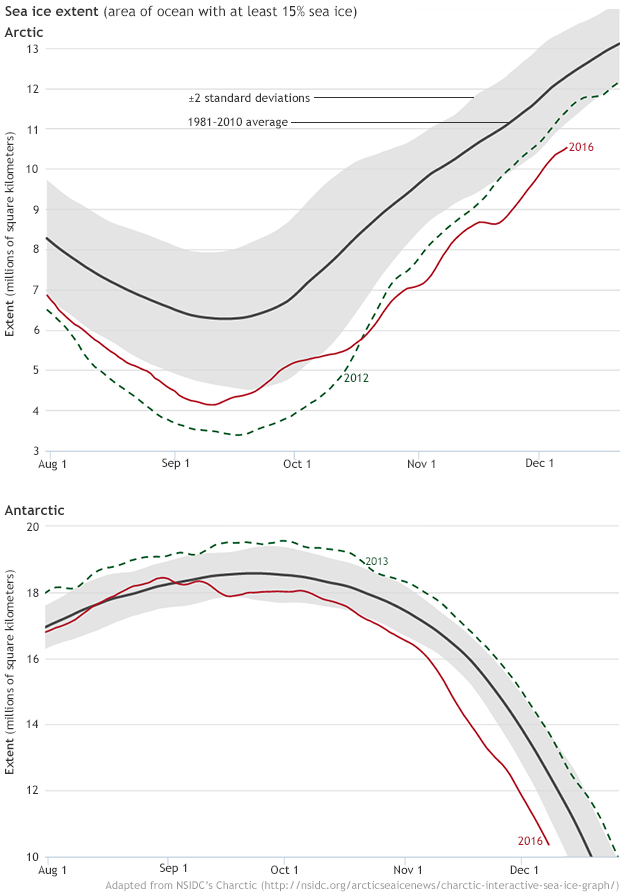
These graphs show the five-day running mean of Arctic (top) and Antarctic (bottom) sea ice extents, August 1 – December 20, 2016. For a five-day period in November, Arctic sea ice actually declined. (Note that the difference from the long-term average is not the same for running daily means as for monthly averages.) Adapted from NSIDC's Charctic.
In November 2016, Arctic sea ice extent was 3.2 standard deviations below the 1981–2010 average. The chance of that happening is 1 in 1,000. At the same time, Antarctic sea ice extent was 5.7 standard deviations below its 1981–2010 November average. The chance of that happening is 1 in 100,000,000!
Widespread warmth in the Arctic
In November 2016, Arctic sea ice extent averaged 3.51 million square miles (9.08 million square kilometers) over the course of the month.
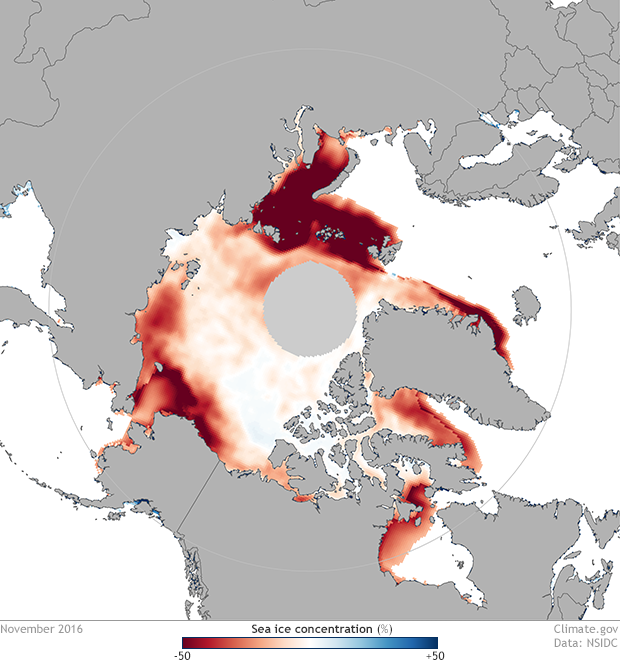
This map shows Arctic sea ice concentration anomalies in November 2016, based on data from the National Snow and Ice Data Center. Areas with unusually high concentration are blue, and areas with unusually low concentration are red. The darker the color, the greater the difference from the difference from the long-term average.
November usually falls within the Arctic sea ice growth season: the summer minimum usually occurs in mid to late September. And sea ice extent did grow rapidly for part of the month, but then it reversed course and actually declined for five straight days, losing a total of roughly 19,000 square miles (50,000 square kilometers). The reversal was nearly unprecedented; in 2013, Arctic sea ice experienced a similar, though much smaller fall retreat: two consecutive days of melt, during which 5,400 square miles (14,000 square kilometers) of ice was lost.
The five-day sea ice retreat in November 2016 coincided with a period of remarkable warmth across the region, with air temperatures 30°F–35°F above normal. NSIDC lead scientist Ted Scambos provides some context. "In the contiguous United States, on any given day, the record high temperature for a region, like eastern Colorado or Pennsylvania, might be 30 to 35°F above the average for that day. In the Arctic in mid-November, an area the size of the entire contiguous U.S. had temperatures that far above the norm, all at the same time."
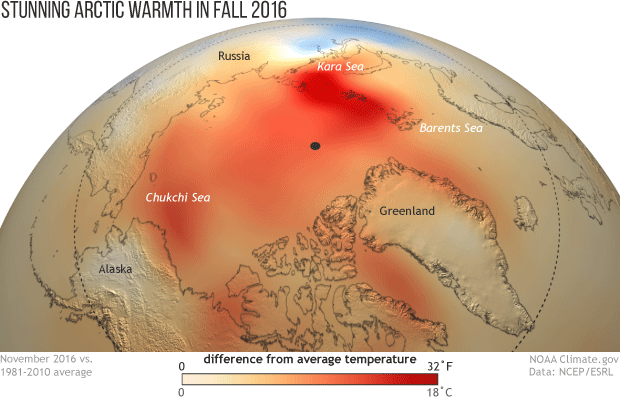
This image shows the November 2016 temperature difference from the 1981–2010 average. The darker the shade of orange-red, the higher the temperature anomaly.
NSIDC reported that air temperatures near the North Pole averaged 18°F (10°C) above the 1981–2010 mean for the month of November overall.
Antarctica presents a puzzle
In November 2016, Antarctic sea ice extent averaged 5.61 million square miles (14.54 million square kilometers) over the course of the month.
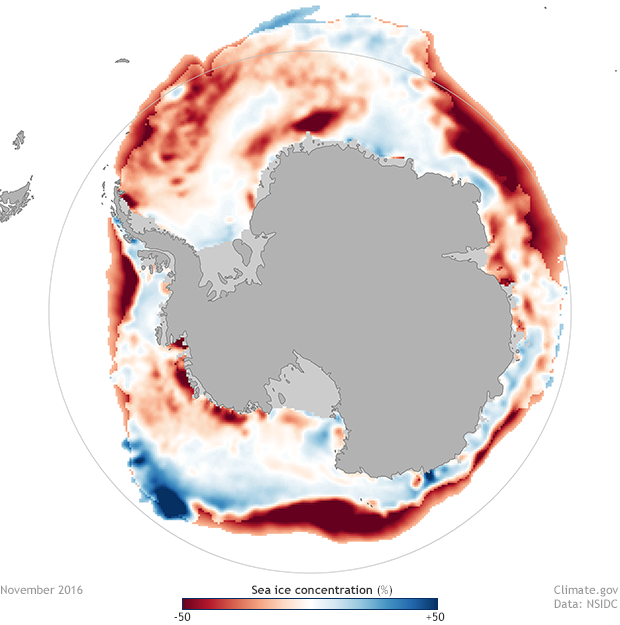
This map shows Antarctic sea ice concentration anomalies in November 2016, based on data from the National Snow and Ice Data Center. Areas with unusually high concentration are blue, and areas with unusually low concentration are red. The darker the color, the greater the difference from the difference from the long-term average.
Given the unusual fall warmth across the Arctic and the already low summertime minimum extent, the low November extent there was not very surprising. But warmth in Antarctica was much more modest in November 2016. In late October and early November 2016, air temperatures along the Antarctic sea ice edge averaged just 2°F–6°F (1°C–3°C) above normal. In light of those temperatures, the rapid decline in the Southern Hemisphere to nearly 6 standard deviations below average is more puzzling.
The Arctic and Antarctic experience opposite seasons, so while Arctic sea ice typically starts regrowing in November, spring is arriving in the Antarctic, and sea ice is typically retreating. Antarctic sea ice normally melts at this time of year, but the November 2016 Antarctic extent was the lowest on record.
Shifting wind patterns around Antarctica likely played a role. One way that climate scientists track Southern Hemipshere winds is through a pattern called the Southern Annular Mode (SAM). The pattern is similar to the Arctic Oscillation, just in the opposite hemisphere. The Southern Annular Mode is tracked with an index that describes the strength of the winds that circle Antarctica. When the winds are regular and strong, the Southern Annular Mode is said to be positive. When the SAM is in negative mode, the winds can blow in different directions.
In August 2016, the SAM was negative, and Antarctica experienced a disorganized pattern of winds. In September, the SAM flipped to a strongly positive mode, so wind patterns had changed to persistent, circular westerly winds. Then in November, a deeply negative SAM and associated disorganized wind pattern resumed. Ryan Fogt, director of the Scalia Laboratory for Atmospheric Analysis at Ohio State University, observes, "The Marshall SAM index was -3.12 in November, the most negative in 20 years (since 1997, when it was -3.17), so the September–November change is quite large." In November, winds began blowing from the north in several areas around Antarctica, pushing the ice pack toward the coast, and opening up polynyas.
But even accounting for changes in winds, the unusually rapid retreat of Antarctic sea ice took NSIDC scientists by surprise. "What the heck just happened?" Scambos asks. "The sea ice anomaly is so much larger than any previous November. Temperatures and winds, the things we rely on to explain ice conditions, weren't as unusual as what happened to sea ice."