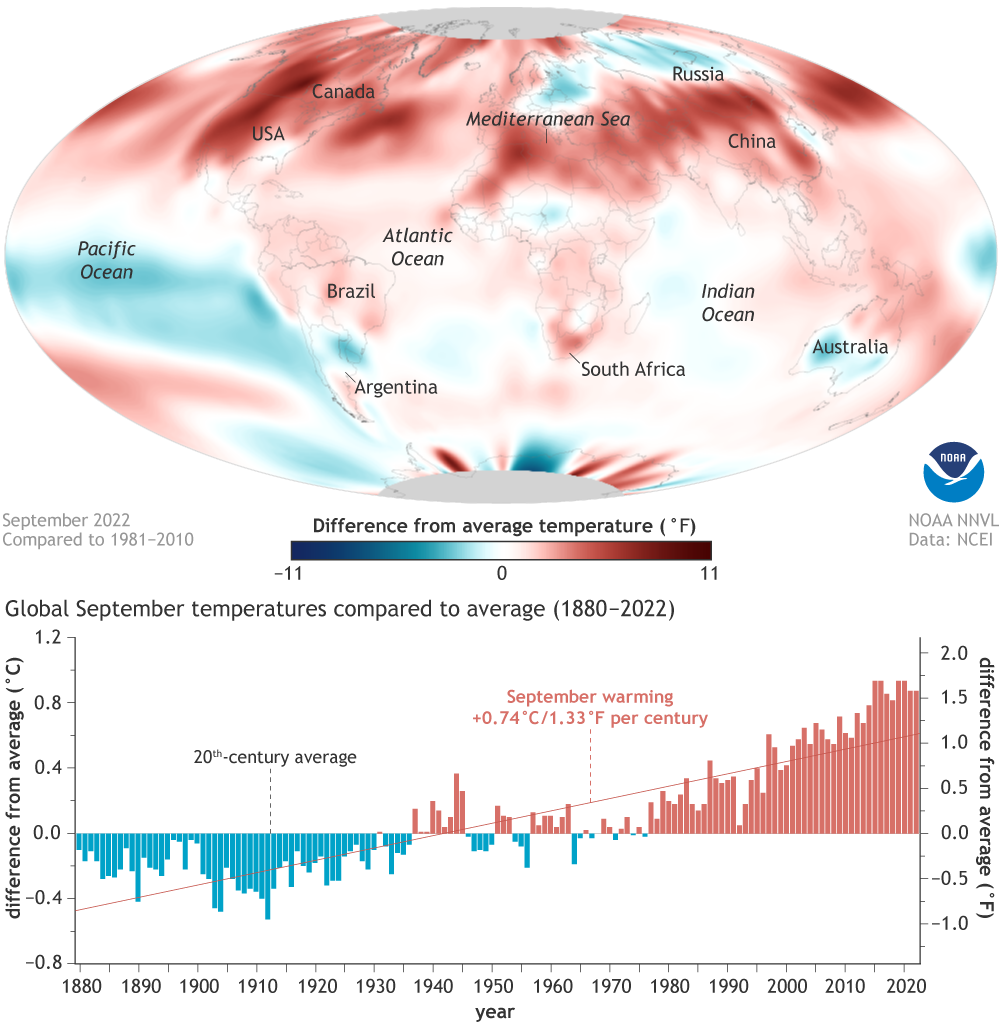
(top) Surface temperature in September 2022 compared to the 1981-2010 average, with places that were 11 or more degrees Fahrenheit warmer than average in darkest red, and places that were 11 or more degrees cooler than average in darkest blue. Much warmer than average temperatures dominated the Northern Hemisphere, while the tropical Pacific Ocean was cooler than average—a sign of the ongoing La Niña climate pattern. (bottom) September temperatures compared to the twentieth-century average from 1880–2022. Cooler-than-average Septembers are blue, and warmer-than-average Septembers are red. Septembers are warming at an average rate of 1.33 degrees Fahrenheit (0.74 degrees Celsius) per century. NOAA Climate.gov image, based on data provided by NOAA National Centers for Environmental Information.