Summer 2012 brought record-breaking melt to Greenland
A massive ice sheet almost completely covers Greenland, and as summertime temperatures climb and sunlight hours lengthen, parts of the ice sheet surface usually melt, especially at lower elevations near the coast. The summer of 2012, however, brought far more extensive melt than anything observed in the satellite record. In July 2012, surface melt extended over nearly the entire ice sheet—not just around the edges, but also on the high-elevation center.
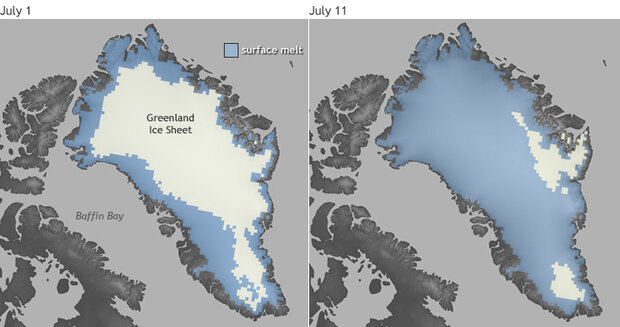
Surface-melt conditions on the Greenland Ice Sheet on July 1, 2012 (left), and July 11, 2012 (right). Based on observations by the Special Sensor Microwave/Imagers from the Defense Meteorological Satellite Program (DMSP) satellites. Ice undergoing surface melt appears blue, and ice that is not melting appears white. Maps by NOAA climate.gov team, based on data provided by Thomas Mote, University of Georgia. Large photos: July 1 | July 11
These images compare surface-melt conditions on the Greenland Ice Sheet on July 1, 2012 (left), and July 11, 2012 (right). The images were made from observations by the Special Sensor Microwave/Imagers from the Defense Meteorological Satellite Program (DMSP) satellites. Ice undergoing surface melt appears blue, and ice that is not melting appears white.
Some patches of ice escape melt on July 11, but this is a snapshot of a single day. Most areas that avoided surface melt on July 11 experienced melt around that date. An estimated 97 percent of the ice sheet surface melted on July 11 and 12, 2012, and virtually the entire ice sheet surface melted at some point in July 2012. For comparison, from 1981 to 2010, the surface melt extent on a typical July day was roughly 25%.
There is an even more telling indicator of the state of the Greenland Ice Sheet than the total area melting on a single day, and that indicator is the melt index. The melt index is calculated by multiplying the number of days that melt occurred by the area where melt was detected. Scientists use a standardized melt index (shown in the graph below) to put a given year’s melt index value into a historical context; that approach compares that year’s melt index value to the long-term average and the amount of year to year variability in the whole time series. The 2012 melt index was +2.4, compared to the 1979-2012 average. This was nearly twice the previous melt index record, set in 2010, of +1.3.
Graph of Greenland melt index adapted from Figure 5.9 in the 2012 Arctic Report Card.
Not only did Greenland Ice Sheet surface melt in 2012 occur over a bigger-than-average area, it also began about two weeks earlier at lower elevations and, for any given elevation, lasted longer. Some researchers blamed ice sheet surface melt for unusually severe flooding at Kangerlussuaq, an air-transportation hub in southwestern Greenland.
More information about the state of the Greenland Ice Sheet can be found in Chapter 5 of the 2012 Arctic Report Card.
Reviewed by Thomas Mote, University of Georgia.
![]()