August 2021 global climate summary
NOAA’s National Centers for Environmental Information (NCEI) have released the global climate summary for August 2021, concluding that the average surface temperature for the planet was the sixth-warmest on record. Statistically, there is a greater than 99 percent chance that 2021 will wind up among the 10 warmest years in the 142-year record. According to NCEI’s Climate at a Glance tool, August has gotten warmer at the rate of 0.08 degrees Celsius (0.14 degrees Fahrenheit) per decade since 1880.
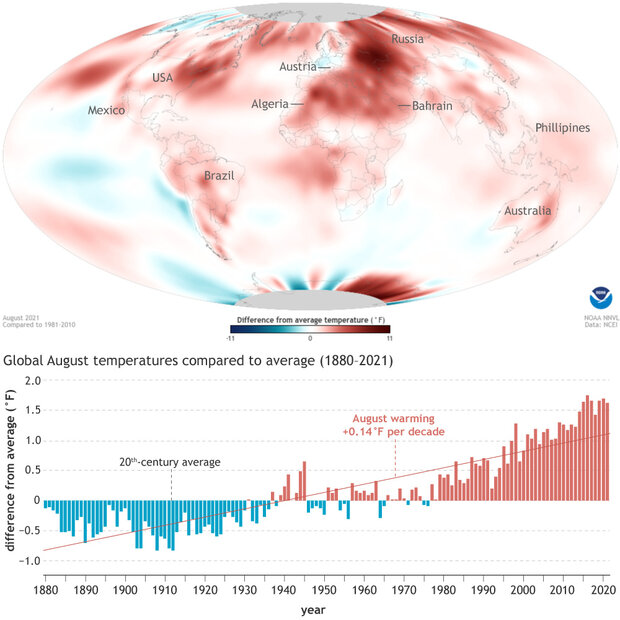
(top) Global temperatures in August 2021 compared to the 1981-2010 average. (bottom) Global temperature each August since 1880 compared to the 20th-century average. NOAA Climate.gov image, based on data from NCEI.
According the report,
The August 2021 global surface temperature was 1.62°F (0.90°C) above the 20th-century average of 60.1°F (15.6°C) -- the sixth-warmest August in the 142-year record. Nine of the 10 warmest Augusts have occurred since 2009. August 2021 also marked the 45th consecutive August and the 440th consecutive month with temperatures, at least nominally, above the 20th-century average.
The August global land-only surface temperature was the second highest for the month. Only August of 2016 was warmer. The near-record warm global land surface temperature was mainly driven by the record-warm Northern Hemisphere land surface August temperature.
Precipitation is always more variable from place to place than temperature. This August, there were stark contrasts in difference from average precipitation both within and between continents.
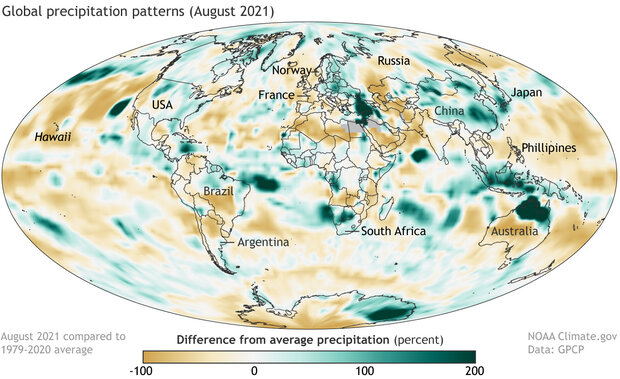
Percent difference from average precipitation in August 2021, based on satellite data from the Global Precipitation Climatology Project. Places that received near their long-term average August precipitation appear white, while places that received up to 200 percent more than their average precipitation are dark green. To see maps of total precipitation and precipitation departures in millimeters per day, see the Precipitation section of the August 2021 Global Climate Report from NCEI.
Drier-than-average conditions in much of the U.S. West contrasted with wetter-than-average conditions in the East. Western Europe was drier-than-average, while Eastern Europe was wetter. North Africa received less than their average precipitation, while southern Africa received more.
For more details about global climate in August 2021 and for the year to date, see Assessing the Global Climate in August 2021 from NCEI.